

Specifying Surface Aerosol Emissions for Simulations with Multi-Modal Aerosol#
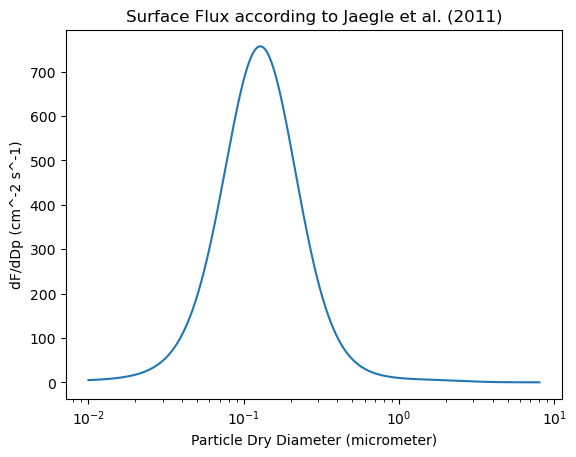
Here we provide an approach to attribute size-resolved aerosol surface fluxes with individual aerosol modes used in LES and SCM
Surface fluxes are taken from Jaegle et al. (2011) and aerosol modes determined from ground-based in-situ observations
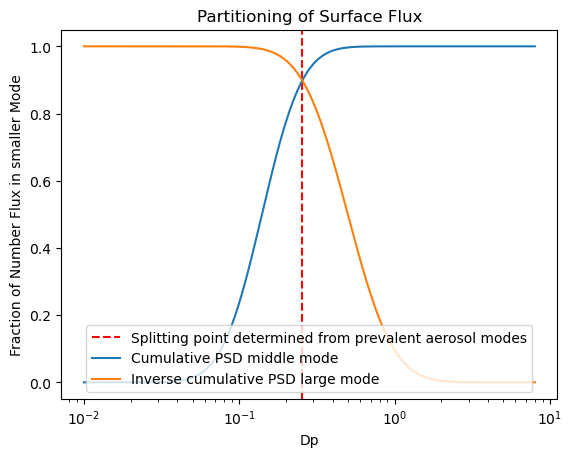
Aerosol modes help to obtain an aerosol diameter to split surface fluxes into two groups.
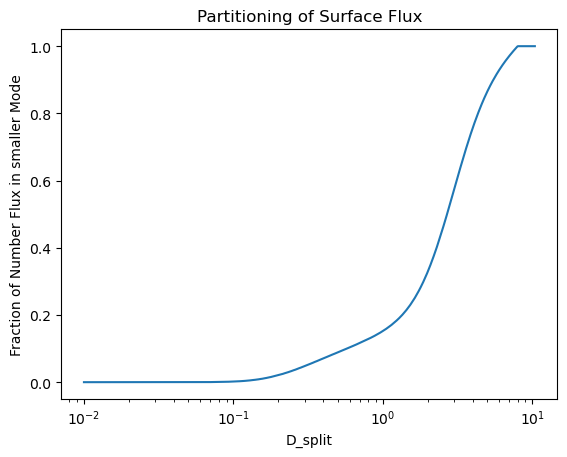
Below approach delivers the fraction of total number flux (i.e., intergrated over all sizes) attributed to each of two modes
While the total flux may change (e.g., from windspeed), the fraction remains constant.
import pandas as pd
import numpy as np
import matplotlib.pyplot as plt
## use coefficients by Jaegle et al. (2011) to generate a small data base of surface flux size distribution
SST = 5
vh = 20
STEP = 0.001

JAEGLE_DAT = pd.DataFrame()
NUM_TOT = 0.0
## loop over a range of diameters
for DD in np.arange(0.01,8.,STEP):
    A = 4.7*(1 + 30 * (DD))**(-0.017*(DD)**(-1.44))
    B =(0.433 - np.log10(DD))/0.433
    SST_TERM = (0.3 + 0.1*SST - 0.0076*SST**2.0 + 0.00021*SST**3.0)

    ## number flux
    FN = SST_TERM*1.373*vh**3.41*(DD)**(-A)*(1+0.057*(DD)**3.45)*10**(1.607*np.exp(-B**2.0)) / 100 /100

    ## associated area flux
    SA = FN*np.pi*(DD**2)

    ## compute total number
    NUM_TOT += FN*STEP

    ## store in data frame
    TMP = pd.DataFrame([[DD,FN,SA,vh,SST]],columns=['Dp','FN','SA','vh','SST'])
    JAEGLE_DAT = pd.concat([JAEGLE_DAT,TMP])


plt.plot(JAEGLE_DAT['Dp'],JAEGLE_DAT['FN'])
plt.xscale("log",base=10)
plt.xlabel('Particle Dry Diameter (micrometer)')
plt.ylabel('dF/dDp (cm^-2 s^-1)')
plt.title('Surface Flux according to Jaegle et al. (2011)')


print('Total number flux: ' + str(np.round(NUM_TOT)) + ' cm^-2 s^-1')
Total number flux: 176.0 cm^-2 s^-1
## partition into two groups and integrate over size
def split_flux(DAT,D_s,STEP,mode='number'):
    if mode=='number':
        #num_1 = np.sum(DAT.loc[DAT['Dp'] <  D_s - STEP/2]['FN'] * np.log10((DAT.loc[DAT['Dp'] <  D_s - STEP/2]['Dp']+STEP) / DAT.loc[DAT['Dp'] <  D_s- STEP/2]['Dp']))
        #num_2 = np.sum(DAT.loc[DAT['Dp'] >= D_s - STEP/2]['FN'] * np.log10((DAT.loc[DAT['Dp'] >= D_s - STEP/2]['Dp']+STEP) / DAT.loc[DAT['Dp'] >= D_s - STEP/2]['Dp']))
        num_1 = np.sum(DAT.loc[DAT['Dp'] <  D_s - STEP/2]['FN'] * STEP)
        num_2 = np.sum(DAT.loc[DAT['Dp'] >= D_s - STEP/2]['FN'] * STEP)
    else:
        num_1 = np.sum(DAT.loc[DAT['Dp'] <  D_s - STEP/2]['SA'] * STEP)
        num_2 = np.sum(DAT.loc[DAT['Dp'] >= D_s - STEP/2]['SA'] * STEP)

    return [num_1/(num_1 + num_2),num_2/(num_1 + num_2)]

PARTITION_DAT = pd.DataFrame()
## loop over a range of diameters
for DD_split in np.arange(np.log(0.01),np.log(10.5),0.01):
    TMP   = split_flux(JAEGLE_DAT,D_s = np.exp(DD_split),STEP=STEP,mode='number')
    TMP_2 = split_flux(JAEGLE_DAT,D_s = np.exp(DD_split),STEP=STEP,mode='area')
    TMP_DAT = pd.DataFrame([[TMP[0],TMP[1],TMP_2[0],TMP_2[1],np.exp(DD_split)]],columns=['frac_1','frac_2','frac_area_1','frac_area_2','D_split'])
    PARTITION_DAT = pd.concat([PARTITION_DAT,TMP_DAT])

plt.plot(PARTITION_DAT['D_split'],PARTITION_DAT['frac_area_1'])
plt.xscale("log")
plt.xlabel('D_split')
plt.ylabel('Fraction of Number Flux in smaller Mode')
plt.title('Partitioning of Surface Flux')
Text(0.5, 1.0, 'Partitioning of Surface Flux')
import math

## utilize modes as specified by aerosol team (i.e., A. Williams and L. Russell)
PSD_zsm = pd.read_excel('https://docs.google.com/spreadsheets/d/' +
                        '1q4YkJc5dF-ZOIx-xWU_IkmTYCUPoM0kODj5ro_7Vg_c' +
                        '/export?gid=0&format=xlsx',
                        sheet_name='PSD')

PSD_zsm
| Mode | N_a | D_g | sigma_g | kappa | |
|---|---|---|---|---|---|
| 0 | Aitken | 58 | 0.04 | 1.7 | 0.3 |
| 1 | Accumulation | 134 | 0.14 | 1.6 | 0.5 |
| 2 | Sea Spray | 2 | 0.50 | 1.7 | 0.9 |
## determine where normalized middle and large mode intercept in density

INTERCEPT_DAT = pd.DataFrame()
for DD in np.arange(0.01,8.,STEP):
    d_1 = DD*1000
    d_2 = 10000

    num_frac_1 = 0.5*(1 + math.erf((np.log(d_1) - np.log(PSD_zsm['D_g'][1]*1000)) / (np.log(PSD_zsm['sigma_g'][1])* np.sqrt(2))))
    num_frac_2 = 0.5*(1 + math.erf((np.log(d_1) - np.log(PSD_zsm['D_g'][2]*1000)) / (np.log(PSD_zsm['sigma_g'][2])* np.sqrt(2))))

    exp_sd_2 = np.exp(2*np.log(PSD_zsm['sigma_g'][1])**2)
    dum_1 = np.log(d_1/(PSD_zsm['D_g'][1]*1000*exp_sd_2))/(np.sqrt(2)*np.log(PSD_zsm['sigma_g'][1]))
    dum_2 = np.log(d_2/(PSD_zsm['D_g'][1]*1000*exp_sd_2))/(np.sqrt(2)*np.log(PSD_zsm['sigma_g'][1]))
    area_frac_1 = 0.5*(math.erf(dum_2) - math.erf(dum_1))

    exp_sd_2 = np.exp(2*np.log(PSD_zsm['sigma_g'][2])**2)
    dum_1 = np.log(d_1/(PSD_zsm['D_g'][2]*1000*exp_sd_2))/(np.sqrt(2)*np.log(PSD_zsm['sigma_g'][2]))
    dum_2 = np.log(d_2/(PSD_zsm['D_g'][2]*1000*exp_sd_2))/(np.sqrt(2)*np.log(PSD_zsm['sigma_g'][2]))
    area_frac_2 = 0.5*(math.erf(dum_2) - math.erf(dum_1))

    ## store in data frame
    TMP = pd.DataFrame([[DD,num_frac_1,num_frac_2,area_frac_1,area_frac_2]],columns=['Dp','num_frac_1','num_frac_2','area_frac_1','area_frac_2'])
    INTERCEPT_DAT = pd.concat([INTERCEPT_DAT,TMP])
INTERCEPT_DAT['num_frac_diff'] = np.abs(INTERCEPT_DAT['num_frac_1'] - (1 - INTERCEPT_DAT['num_frac_2']))
D_split = INTERCEPT_DAT['Dp'][INTERCEPT_DAT['num_frac_diff'] == INTERCEPT_DAT['num_frac_diff'].min()][0]
print('Normalized middle and large mode intercept at ' + str(np.round(D_split*1000)) + ' nm')
Normalized middle and large mode intercept at 255.0 nm
plt.axvline(x = D_split, color = 'r', ls='dashed',label = 'Splitting point determined from prevalent aerosol modes')
plt.plot(INTERCEPT_DAT['Dp'],INTERCEPT_DAT['num_frac_1'],label='Cumulative PSD middle mode')
plt.plot(INTERCEPT_DAT['Dp'],1-INTERCEPT_DAT['num_frac_2'],label='Inverse cumulative PSD large mode')
plt.xscale("log")
plt.xlabel('Dp')
plt.ylabel('Fraction of Number Flux in smaller Mode')
plt.title('Partitioning of Surface Flux')
plt.legend(loc=8)
<matplotlib.legend.Legend at 0x7f3929b7abf0>
## apply simple determination of splitting point based on middle mode
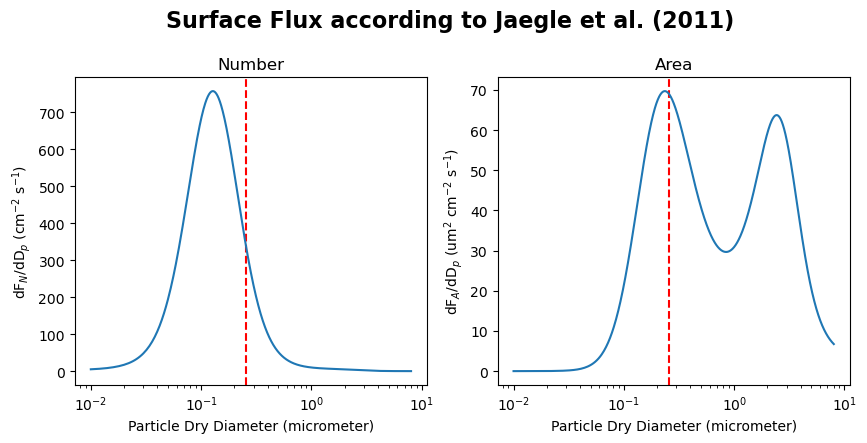
print('Splitting modes at ' + str(np.round(D_split,3)) + ' um')

## look up proportion of flux
PARTITION_DAT['Dp_dist'] = np.abs(PARTITION_DAT['D_split'] - D_split)
PARTITION_DAT.loc[PARTITION_DAT['Dp_dist']==PARTITION_DAT['Dp_dist'].min()]

print('Number-equivalent flux: middle mode receives '+
      str(np.round(PARTITION_DAT.loc[PARTITION_DAT['Dp_dist']==PARTITION_DAT['Dp_dist'].min()]['frac_1'][0],3))+
      ' and large receives '+
      str(np.round(PARTITION_DAT.loc[PARTITION_DAT['Dp_dist']==PARTITION_DAT['Dp_dist'].min()]['frac_2'][0],3)))

print('Area-equivalent flux: middle mode receives '+
      str(np.round(PARTITION_DAT.loc[PARTITION_DAT['Dp_dist']==PARTITION_DAT['Dp_dist'].min()]['frac_area_1'][0],3))+
      ' and large receives '+
      str(np.round(PARTITION_DAT.loc[PARTITION_DAT['Dp_dist']==PARTITION_DAT['Dp_dist'].min()]['frac_area_2'][0],3)))
Splitting modes at 0.255 um
Number-equivalent flux: middle mode receives 0.67 and large receives 0.33
Area-equivalent flux: middle mode receives 0.036 and large receives 0.964
#plt.plot(PARTITION_DAT['D_split'],PARTITION_DAT['num_1'])
#plt.axvline(x = D_split, color = 'r', ls='dashed',label = 'Splitting point determined from prevalent aerosol modes')
#plt.xscale("log")
#plt.xlabel('D_split')
#plt.ylabel('Fraction of Number Flux in smaller Mode')
#plt.title('Partitioning of Surface Flux')

fig, (ax1, ax2) = plt.subplots(1, 2, figsize=(10, 4))
fig.suptitle('Surface Flux according to Jaegle et al. (2011)', fontsize=16, fontweight='bold', y=1.05)

ax1.set_xscale('log')
ax1.axvline(x = D_split, color = 'r', ls='dashed',label = 'Splitting point determined from prevalent aerosol modes')
ax1.plot(JAEGLE_DAT['Dp'],JAEGLE_DAT['FN'])
ax1.set_xlabel('Particle Dry Diameter (micrometer)')
ax1.set_ylabel('dF$_N$/dD$_p$ (cm$^{-2}$ s$^{-1}$)')
ax1.set_title('Number')

ax2.set_xscale('log')
ax2.axvline(x = D_split, color = 'r', ls='dashed',label = 'Splitting point determined from prevalent aerosol modes')
ax2.plot(JAEGLE_DAT['Dp'],JAEGLE_DAT['SA'])
ax2.set_xlabel('Particle Dry Diameter (micrometer)')
ax2.set_ylabel('dF$_A$/dD$_p$ (um$^2$ cm$^{-2}$ s$^{-1}$)')
ax2.set_title('Area')
Text(0.5, 1.0, 'Area')
plt.xscale('log')
plt.axvline(x = D_split, color = 'r', ls='dashed',label = 'Splitting point determined from prevalent aerosol modes')
plt.plot(JAEGLE_DAT['Dp'],JAEGLE_DAT['FN'])
plt.xlabel('Particle Dry Diameter (micrometer)')
#plt.ylabel('dF$_N$/dlog$_{10}$D$_p$ (cm$^{-2}$ s$^{-1}$)')
plt.ylabel('dF$_N$/dD$_p$ (cm$^{-2}$ s$^{-1}$)')
plt.title('Number')
Text(0.5, 1.0, 'Number')
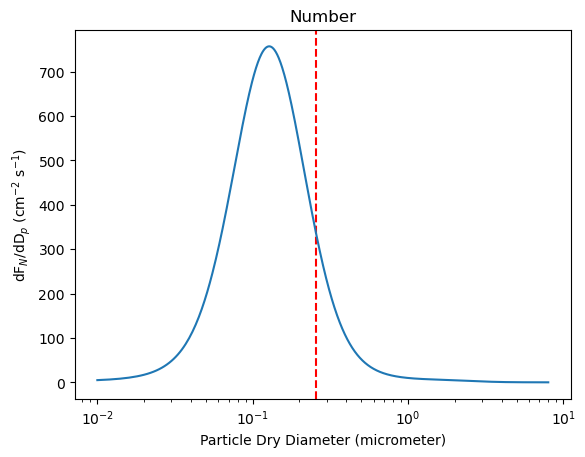
Jaegle et al. (2011) surface particle flux integrated over all sizes#
\(\text{SST}\) is sea surface skin temperature in °C
\(v_h\) is horizontal wind speed at 10 m
\(F_N\) in particle number per square centimeter and second
For example, fluxed into the lowest atmospheric layer: \(S_{srf} = \frac{F_N 10^4}{\rho \Delta z}\)