
Quantitative Precipitation Estimate (QPE) Analysis with Py-ART

Overview
We have previously covered reading of X-Band ARM Scanning Preciptiation Radar (XSAPR) (Bharadwaj et al. (2026)) data, displaying and applying corrections to convective cells associated with the 23 April 2026 Enid, Oklahoma Enhanced Fujita (EF) Scale (EF-4)tornado outbreak.
Within this notebook, we will cover the pyart.retrieve module for calculating quantitative precipitation estimation (QPE). Specifically, this notebook will cover:
Viewing Multiple fields within the Radar Object
Applying a user defined function to the Radar Object
Calculating QPE utilizing a Gatefilter object
Prerequisites
| Concepts | Importance | Notes |
|---|---|---|
| Py-ART Basics | Helpful | Basic features |
| Weather Radar Basics | Helpful | Background Information |
| Matplotlib Basics | Helpful | Basic plotting |
| NumPy Basics | Helpful | Basic arrays |
| Xarray Basics | Helpful | Multi-dimensional arrays |
Time to learn: 15 minutes
# Uncomment if running on CoLab
##!pip install arm_pyart>=2.2.0
##!pip install xradar>=0.12.0
# Uncomment if running on CoLab
##import pathlib
##from pathlib import Path
##import gdown
##DATA_LINK = "1QLRRZMJ-HRQpbhATPqLfF8byJmnYWXzv"
##CREATE_BASE = pathlib.Path("../data")
##CREATE_BASE.mkdir(parents=True, exist_ok=True)
##gdown.download(id=DATA_LINK, output=str(CREATE_BASE / "sgpxsaprcfrI6.a1.20260423.233233.nc"), quiet=False)Imports
import os
import warnings
import glob

import cartopy.crs as ccrs
import matplotlib.pyplot as plt
import numpy as np
import xarray as xr

import pyart
from pyart.testing import get_test_data
import xradar as xd

warnings.filterwarnings('ignore')
Investigate the Available Data
# As in the Py-ART Basics notebook, we begin by loading a XSAPR CF-Radial file for our period of interest.
# Adjust the base path and file name as needed to point to the location of the data on your system (or Colab)
base_path = "../data/"
file = "sgpxsaprcfrI6.a1.20260423.233233.nc"
radar = pyart.io.read(os.path.join(base_path, file))
# Generate a Py-ART display object
display = pyart.graph.RadarDisplay(radar)
# Generate matplotlib figure and axe array objects
fig, axarr = plt.subplots(2, 2, figsize=[20, 12])
plt.subplots_adjust(hspace=0.35)
# reflectivity
display.plot('reflectivity',
sweep=0,
ax=axarr[0, 0],
cmap='ChaseSpectral')
# differential reflectivity
display.plot("differential_reflectivity",
sweep=0,
ax=axarr[0, 1],
cmap="RdBu_r",
vmin=-2,
vmax=2)
# doppler velocity
display.plot("mean_doppler_velocity",
sweep=0,
ax=axarr[1, 0],
cmap="RdBu_r",
vmin=-16,
vmax=16)
# differential phase
display.plot("specific_differential_phase",
sweep=0,
ax=axarr[1, 1],
cmap="ChaseSpectral")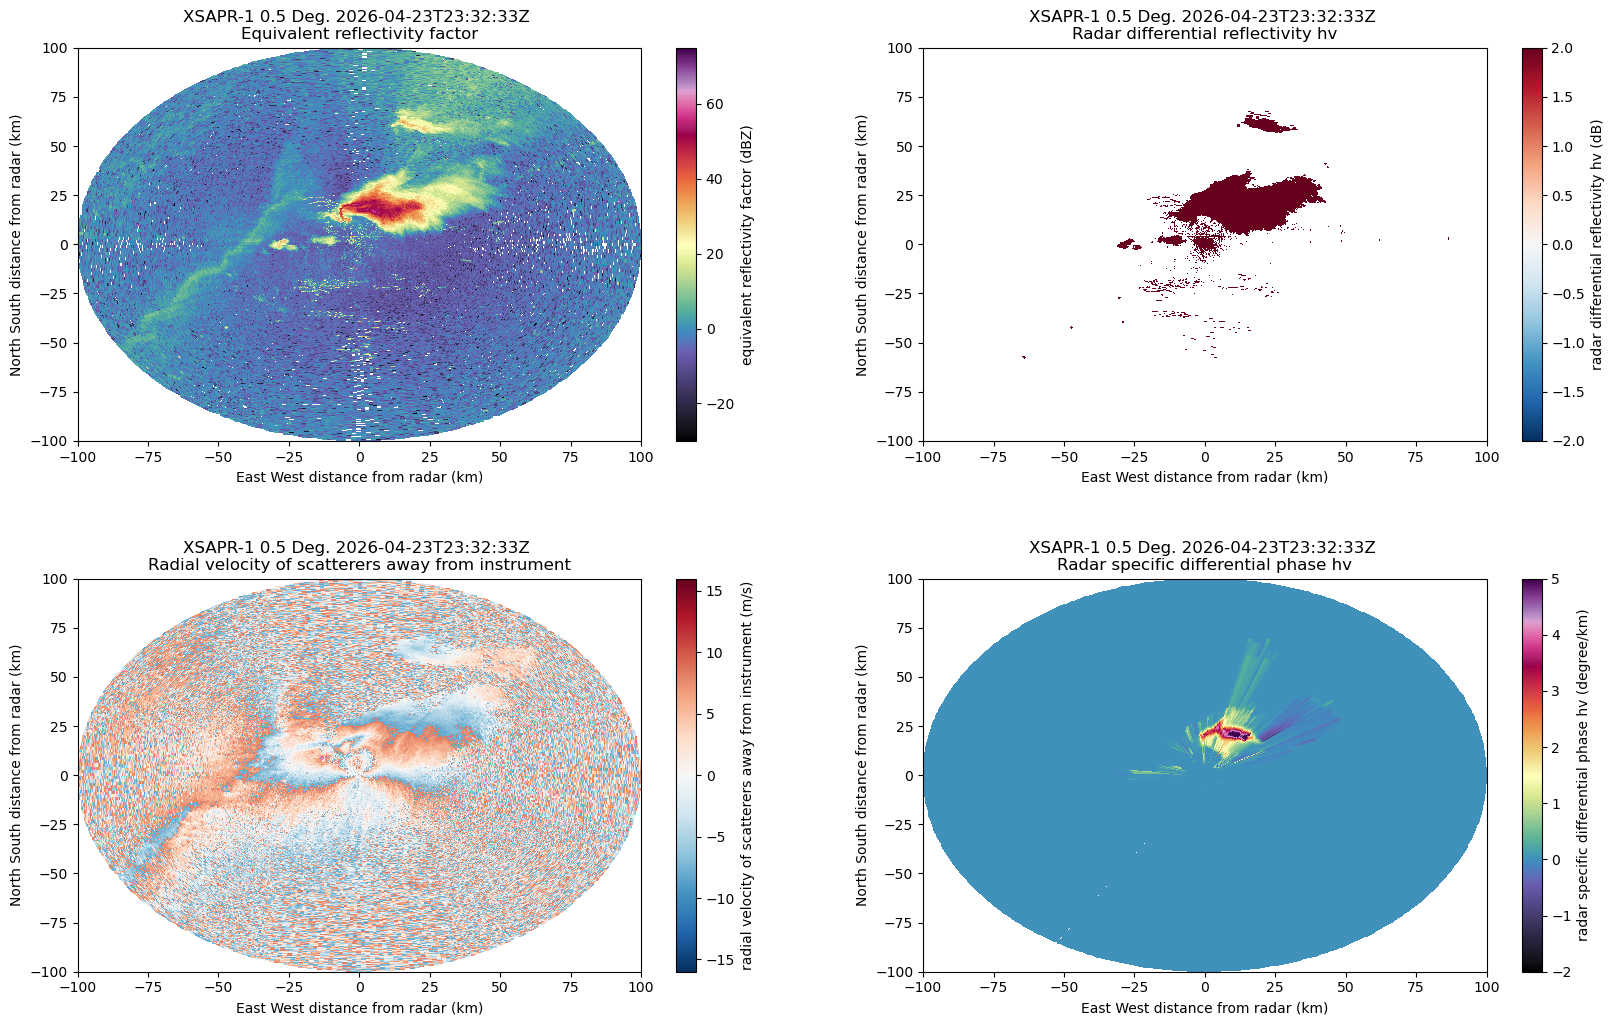
# Generate a Py-ART display object
display = pyart.graph.RadarDisplay(radar)

# Generate matplotlib figure and axe array objects
fig, axarr = plt.subplots(2, 2, figsize=[20, 12])
plt.subplots_adjust(hspace=0.35)

# reflectivity
display.plot('reflectivity',
             sweep=0,
             ax=axarr[0, 0],
             cmap='ChaseSpectral')
axarr[0, 0].set_xlim([-15, 30])
axarr[0, 0].set_ylim([-5, 40])

# differential reflectivity
display.plot("differential_reflectivity",
             sweep=0,
             ax=axarr[0, 1],
             cmap="RdBu_r",
             vmin=-1,
             vmax=20,)
axarr[0, 1].set_xlim([-15, 30])
axarr[0, 1].set_ylim([-5, 40])

# doppler velocity
display.plot("mean_doppler_velocity",
             sweep=0,
             ax=axarr[1, 0],
             cmap="RdBu_r",
             vmin=-16,
             vmax=16,)
axarr[1, 0].set_xlim([-15, 30])
axarr[1, 0].set_ylim([-5, 40])

# differential phase
display.plot("specific_differential_phase",
             sweep=0,
             ax=axarr[1, 1],
             cmap="ChaseSpectral",)
axarr[1, 1].set_xlim([-15, 30])
axarr[1, 1].set_ylim([-5, 40])
(-5.0, 40.0)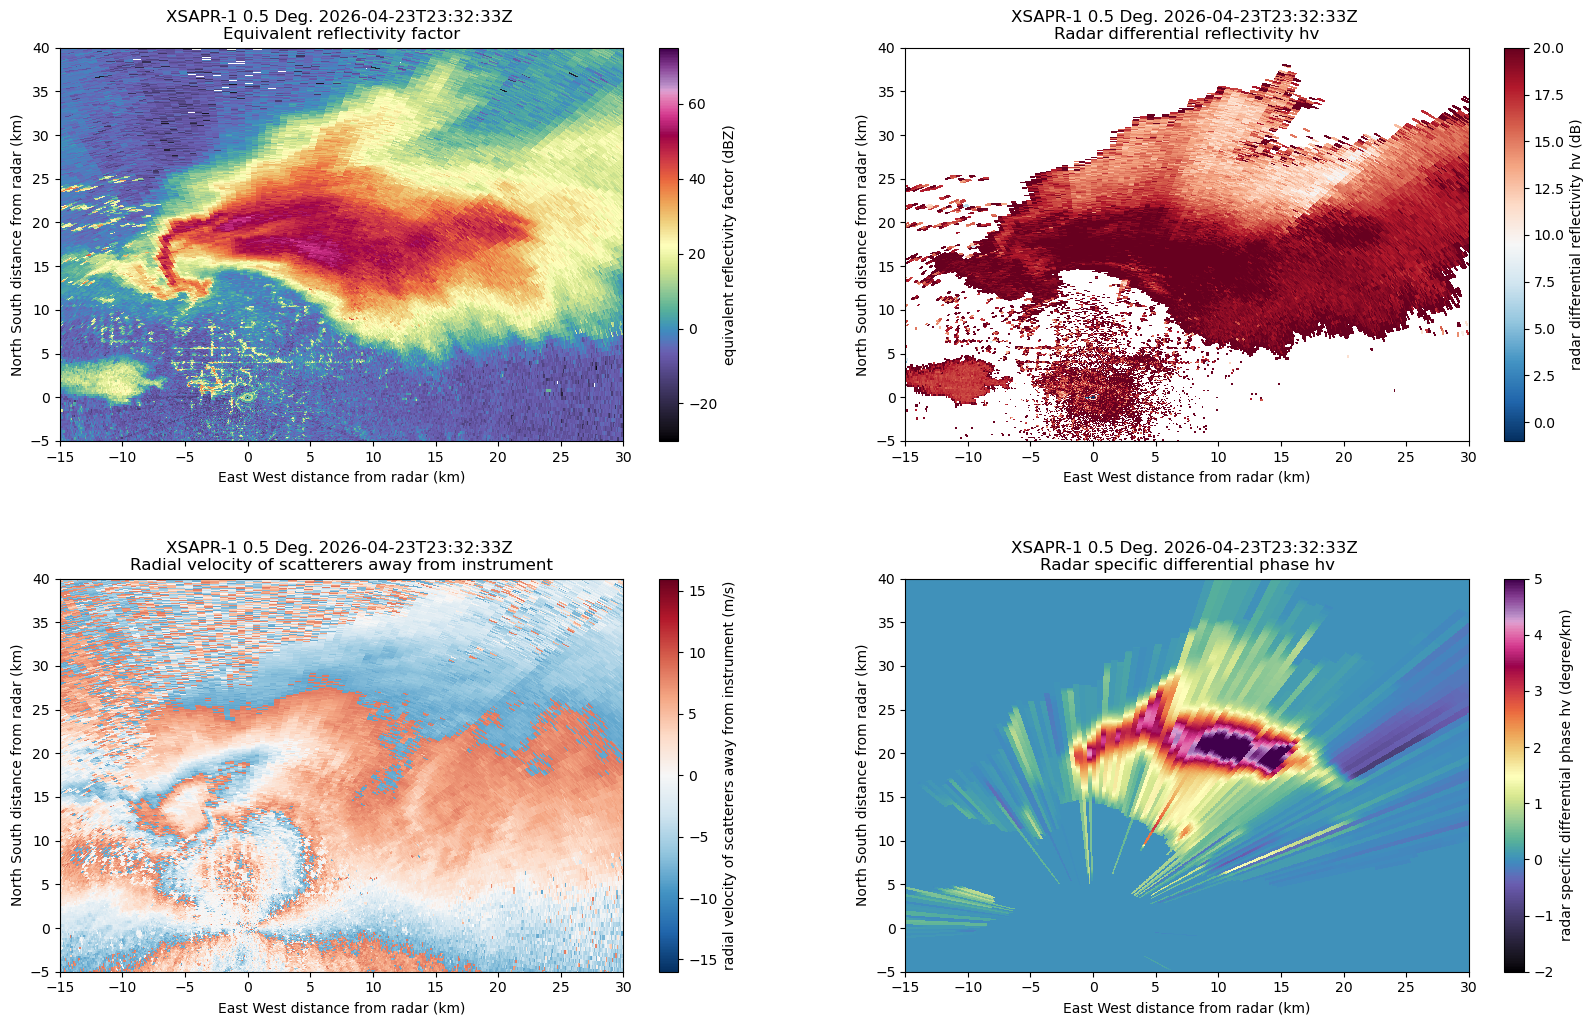
QPE Functions
def reflectivity_rain(radar, refl="reflectivity", alpha=0.0376, beta=0.6112, exclude_above=2.5):
    """
    Function to calculate rainfall rates from radar reflectivity factor
    excluding areas of user defined KDP

    Inputs
    ------
    radar : Py-ART Radar Object
        Py-ART radar object to extract reflectivity field from
    refl : str
        Specific name of reflectivity field within radar object
    alpha : float
        fit parameter
    beta : float
        fit parameter
    exclude_above : float
        reflectivity upper threshold

    Outputs
    -------
    radar : Py-ART Radar Object
        Py-ART radar object with rainfall estimate from reflectivity included
    """
    # define a gatefilter to apply the relationship to
    gatefilter_z = pyart.correct.GateFilter(radar)
    gatefilter_z.exclude_above('specific_differential_phase', exclude_above)
    # Apply the gatefilter to the rain rate
    masked_z = np.ma.masked_array(radar.fields[refl]['data'], mask=gatefilter_z.gate_excluded)
    # Apply the R(Z) relationship
    rr_data = alpha * np.ma.power(np.ma.power(10.0, 0.1 * masked_z), beta)
    # define the dictionary structure for the rain rate data
    rain = pyart.config.get_metadata("radar_estimated_rain_rate")
    rain["long_name"] = "R(Z) Radar Estimated Rain Rate"
    rain["standard_name"] = "R(Z) Radar Estimated Rain Rate"
    rain["data"] = rr_data
    # add the field back into the radar object
    radar.add_field("rain_z", rain, replace_existing=True)

    return radar
def kdp_rain(radar, phase="specific_differential_phase", alpha=25.1, beta=0.777, exclude_below=2.5):
"""
Function to calculate rainfall rates from specific differential phase
Inputs
------
radar : Py-ART Radar Object
Py-ART radar object to extract reflectivity field from
refl : str
Specific name of reflectivity field within radar object
alpha : float
fit parameter
beta : float
fit parameter
exclude_below : float
reflectivity lower threshold
Outputs
-------
radar : Py-ART Radar Object
Py-ART radar object with rainfall estimate from reflectivity included
"""
# define a gatefilter to apply the relationship to
gatefilter_kdp = pyart.correct.GateFilter(radar)
gatefilter_kdp.exclude_below('specific_differential_phase', exclude_below)
# Apply the gatefilter to the rain rate
masked_z = np.ma.masked_array(radar.fields[phase]['data'], mask=gatefilter_kdp.gate_excluded)
# define the reflectivity data
reflect = radar.fields[phase]["data"]
rr_data = alpha * np.ma.power(np.ma.power(10.0, 0.1 * masked_z), beta)
# define the dictionary structure for the rain rate data
rain = pyart.config.get_metadata("radar_estimated_rain_rate")
rain["long_name"] = "R(KDP) Radar Estimated Rain Rate"
rain["standard_name"] = "R(KDP) Radar Estimated Rain Rate"
rain["data"] = rr_data
# add the field back into the radar object
radar.add_field("rain_kdp", rain, replace_existing=True)
return radar# Apply the Radar estimated rain rates
radar = reflectivity_rain(radar)
radar = kdp_rain(radar)display = pyart.graph.RadarDisplay(radar)
# Generate matplotlib figure and axe array objects
fig, axarr = plt.subplots(1, 2, figsize=[14, 5])
plt.subplots_adjust(wspace=0.2, hspace=0.35)
# reflectivity
display.plot('rain_z', sweep=0, ax=axarr[0], cmap='RdBu_r', vmax=75, vmin=1)
axarr[0].set_xlim([-15, 30])
axarr[0].set_ylim([-5, 40])
# differential reflectivity
display.plot("rain_kdp", sweep=0, ax=axarr[1], cmap="RdBu_r", vmax=75, vmin=1)
axarr[1].set_xlim([-15, 30])
axarr[1].set_ylim([-5, 40])(-5.0, 40.0)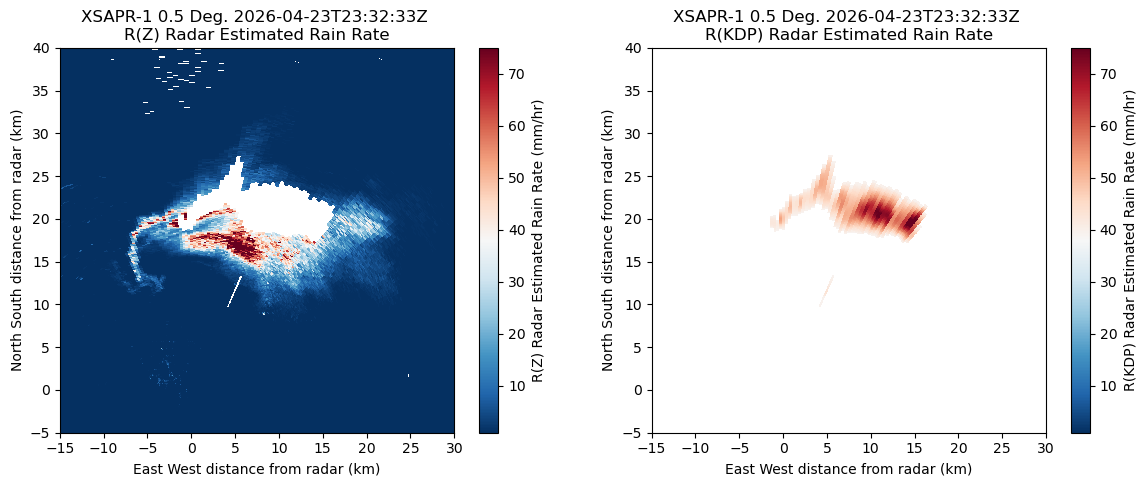
Combined Radar Estimated Rainfall Product
combined_data = np.where(~radar.fields["rain_z"]["data"].mask,
                         radar.fields["rain_z"]["data"],
                         radar.fields["rain_kdp"]["data"])
# Combine the masks using logical OR (mask where either is masked)
combined_mask = np.ma.mask_or(radar.fields["rain_z"]["data"].mask,
                              radar.fields["rain_kdp"]["data"].mask)

# Merge data and apply the combined mask
merged = np.ma.array(combined_data, mask=combined_mask)
# define the dictionary structure for the rain rate data
rain = pyart.config.get_metadata("radar_estimated_rain_rate")
rain["long_name"] = "R(Z+KDP) Radar Estimated Rain Rate"
rain["standard_name"] = "R(Z+KDP) Radar Estimated Rain Rate"
rain["data"] = combined_data
# add the field back into the radar object
radar.add_field("rain_combined", rain, replace_existing=True)display = pyart.graph.RadarDisplay(radar)
# Generate matplotlib figure and axe array objects
fig, axarr = plt.subplots(1, 2, figsize=[14, 5])
plt.subplots_adjust(wspace=0.2, hspace=0.35)
# reflectivity
display.plot('rain_combined', sweep=0, ax=axarr[0], cmap='RdBu_r', vmax=75, vmin=1)
axarr[0].set_xlim([-15, 30])
axarr[0].set_ylim([-5, 40])
# reflectivity
display.plot('reflectivity', sweep=0, ax=axarr[1], cmap='ChaseSpectral')
axarr[1].set_xlim([-15, 30])
axarr[1].set_ylim([-5, 40])(-5.0, 40.0)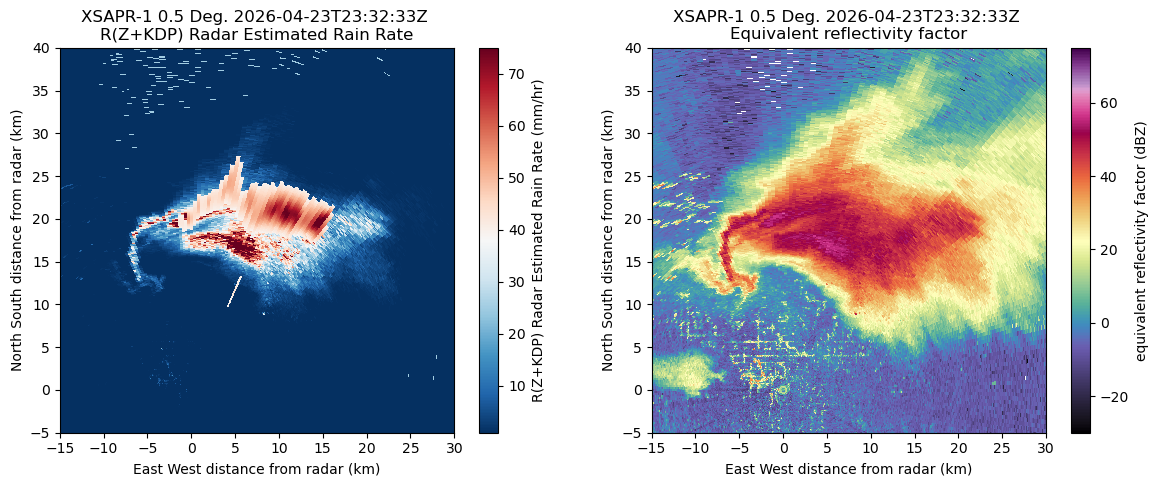
Create a Gridded QPE Product for Future Comparison with Model/MRMS
def sgp_grid(radar,
             z_limits=(500., 15_000.),
             y_limits=(-30_000., 30_000),
             x_limits=(-30_000., 30_000),
             resolution=500
):
    """
    Function to create a Py-ART grid object from a given radar file

    Inputs
    ------
    radar : Py-ART radar object
        Py-ART radar object to create a grid object from
    z_limits : tuple
        vertical dimension grid limits
    y_limits : tuple
        longitude dimension grid limits
    x_limits : tuple
        latitude dimension grid limits
    resolution : float
        desired resolution of our grid object

    Calls
    -----
    compute_number_of_points
        compute number of gates in each direction

    Outputs
    -------
    grid : Py-ART Grid object
    """
    def compute_number_of_points(extent, resolution):
        return int((extent[1] - extent[0])/resolution)

    z_grid_points = compute_number_of_points(z_limits, resolution)
    x_grid_points = compute_number_of_points(x_limits, resolution)
    y_grid_points = compute_number_of_points(y_limits, resolution)
    print(z_grid_points)
    grid = pyart.map.grid_from_radars([radar],
                                      grid_shape=(z_grid_points,
                                                  y_grid_points,
                                                  x_grid_points),
                                      grid_limits=(z_limits,
                                                   y_limits,
                                                   x_limits),
    )

    return grid
grid = sgp_grid(radar)29
display = pyart.graph.GridMapDisplay(grid)
display.plot_grid('rain_combined',
                  level=1,
                  vmin=0.1,
                  vmax=75,
                  cmap='RdBu_r')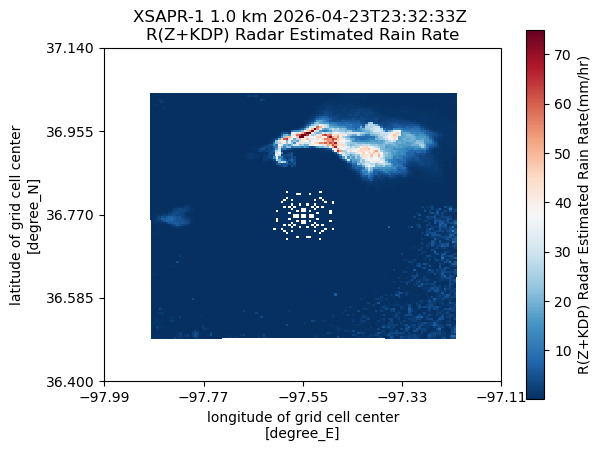
- Bharadwaj, N., Hardin, J., Isom, B., Johnson, K., Lindenmaier, I., Matthews, A., Nelson, D., Feng, Y.-C., Wendler, T., Rocque, M., & et al. (2026). X-Band Scanning ARM Precipitation Radar (XSAPRCFR), 2026-04-23 to 2026-04-24, Southern Great Plains (SGP), Deer Creek, OK (Intermediate) (I6). In Atmospheric Radiation Measurement (ARM) user facility. 10.5439/1463663