Note
Go to the end to download the full example code.
ZDR Bias Calculation
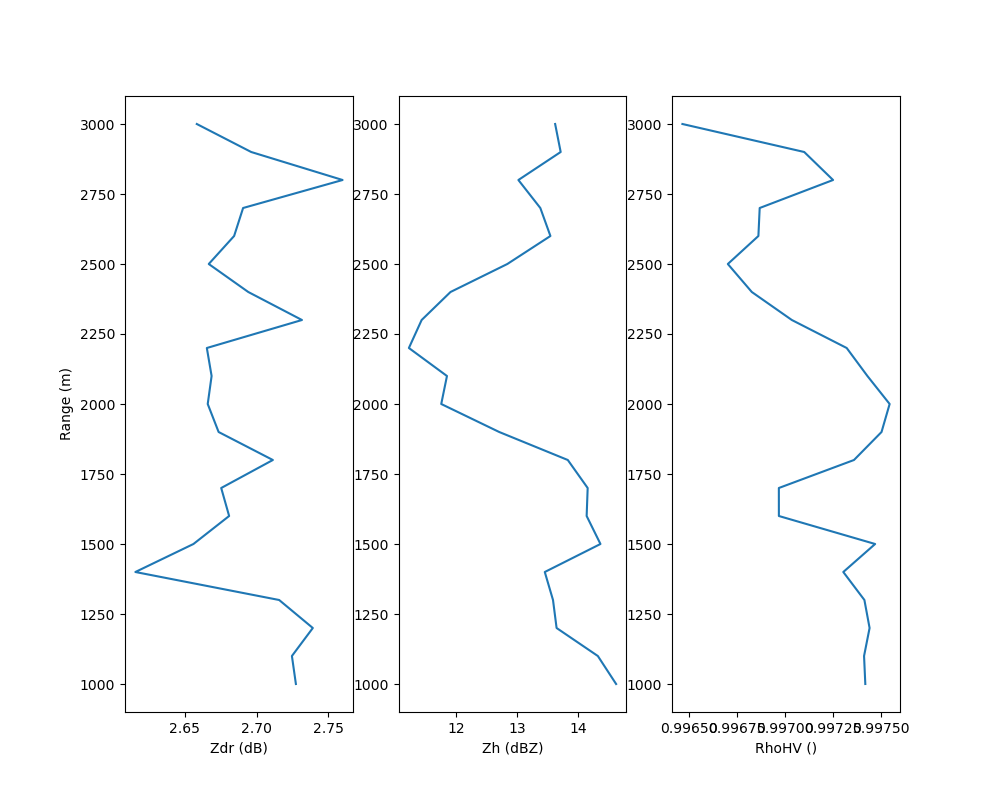
This example shows how to calculate the zdr bias from VPT/Birdbath scans

Zdr Bias: 2.69
import matplotlib.pyplot as plt
from act.io.arm import read_arm_netcdf
from open_radar_data import DATASETS

import radtraq

# Read in example data
filename = DATASETS.fetch('sgpxsaprcfrvptI4.a1.20200205.100827.nc')
ds = read_arm_netcdf(filename)

thresh = {'cross_correlation_ratio_hv': [0.995, 1], 'reflectivity': [10, 30], 'range': [1000, 3000]}

# Call RadTraQ function
results = radtraq.proc.calc_zdr_offset(ds, zdr_var='differential_reflectivity', thresh=thresh)

print('Zdr Bias: ' + '%.2f' % results['bias'])

fig, ax = plt.subplots(1, 3, figsize=(10, 8))
ax[0].plot(results['profile_zdr'], results['range'])
ax[0].set_ylabel('Range (m)')
ax[0].set_xlabel('Zdr (dB)')
ax[1].plot(results['profile_reflectivity'], results['range'])
ax[1].set_xlabel('Zh (dBZ)')
ax[2].plot(results['profile_cross_correlation_ratio_hv'], results['range'])
ax[2].set_xlabel('RhoHV ()')
plt.show()
Total running time of the script: (0 minutes 0.359 seconds)