RadTraq Example Gallery
Different examples on how to use RadTraq
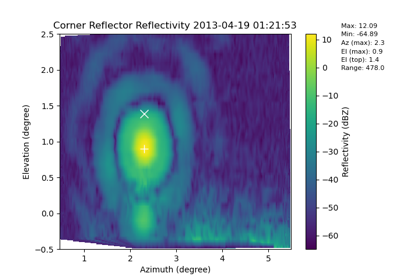
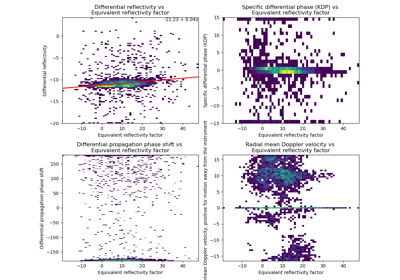
Example on how to plot out a corner reflector raster
Example on how to plot out a corner reflector raster
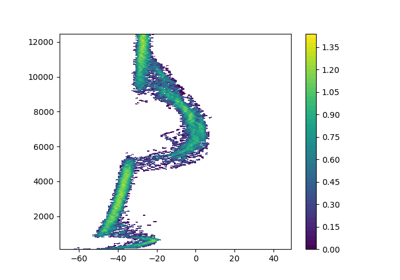
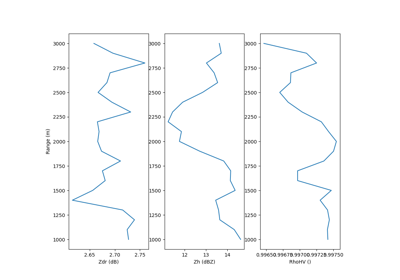
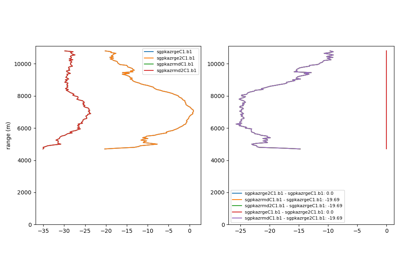
Example on how to calculate and plot average profiles
Example on how to calculate and plot average profiles