Note
Go to the end to download the full example code.
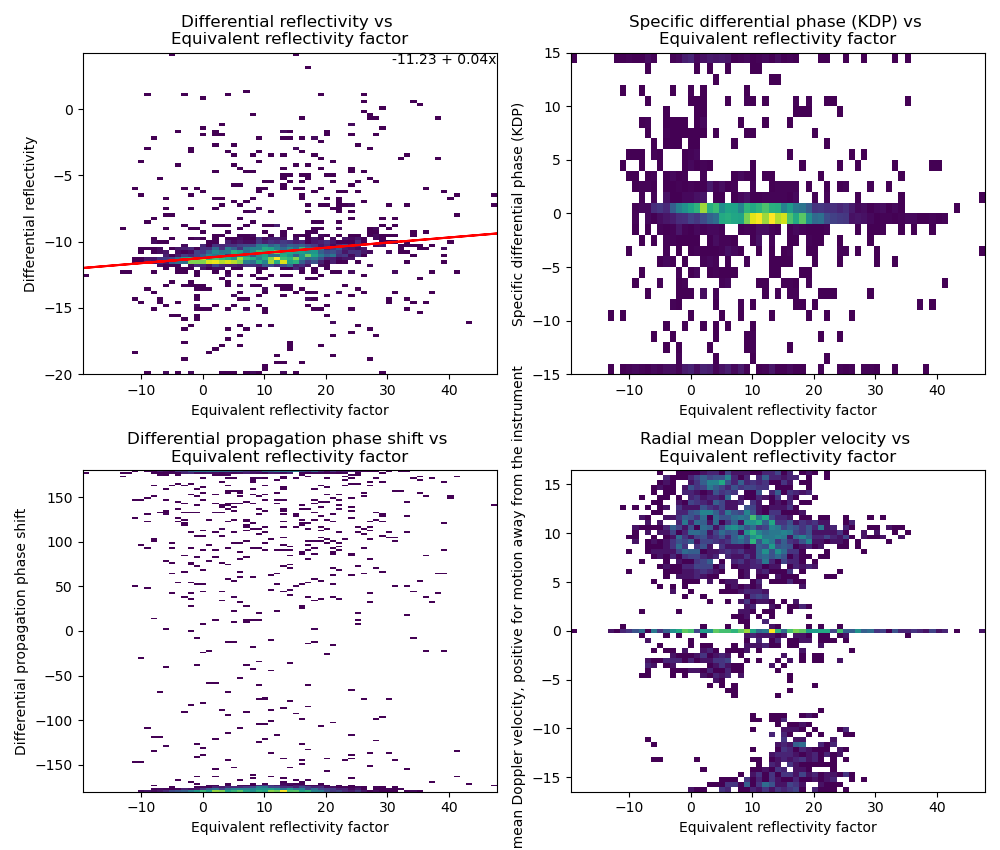
Self-Consistency Plot
This example shows how to create a self-consistency plot
import matplotlib.pyplot as plt
from act.io.arm import read_arm_netcdf
from open_radar_data import DATASETS

import radtraq

# Read in example data
filename = DATASETS.fetch('csapr.nc')
ds = read_arm_netcdf(filename)

# Set thresholds of RhoHv > 0.99
thresh = {'copol_correlation_coeff': 0.99}

# Set up dictionary of variables to plot
var_dict = {
    'differential_reflectivity': {
        'variable': 'reflectivity',
        'bin_width': [1, 0.25],
        'linreg': True,
    },
    'specific_differential_phase': {'variable': 'reflectivity'},
    'differential_phase': {'variable': 'reflectivity', 'bin_width': [1, 2.0]},
    'mean_doppler_velocity': {'variable': 'reflectivity', 'bin_width': [1, 0.5]},
}

# Call RadTraQ function
display = radtraq.plotting.plot_self_consistency(ds, variables=var_dict, thresh=thresh)
plt.show()
Total running time of the script: (0 minutes 1.104 seconds)