Note
Go to the end to download the full example code.
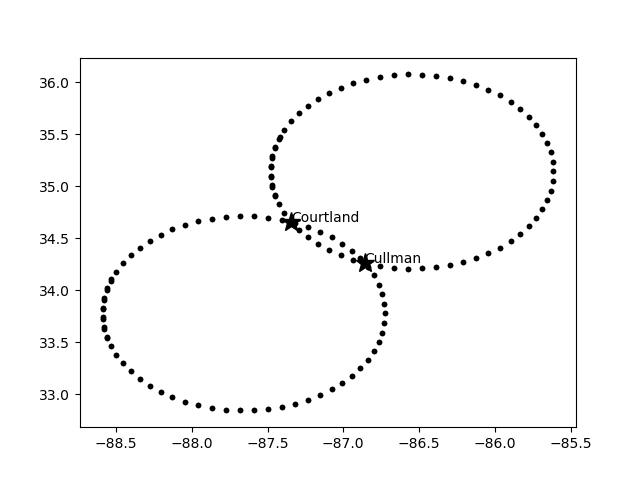
Dual Doppler Lobe Utility
Example for using the utily to plot up dual doppler lobes. Can easily be used on cartopy maps using
- code-block:: python
tiler = Stamen(‘terrain-background’) mercator = tiler.crs fig = plt.figure() ax = fig.add_subplot(1, 1, 1, projection=mercator) ax.add_image(tiler, 8) ax.coastlines(‘10m’)
import matplotlib.pyplot as plt

import radtraq

d = {
    'Cullman': {'lat': 34.26274649951493, 'lon': -86.85874523934974},
    'Courtland': {'lat': 34.658302981847655, 'lon': -87.34389529761859},
}

data = radtraq.utils.calculate_dual_dop_lobes(d)

fig = plt.figure()
ax = fig.add_subplot(1, 1, 1)
for dat in data.keys():
    ax.plot(data[dat]['lon'], data[dat]['lat'], 'k.')
for s in d:
    ax.plot(d[s]['lon'], d[s]['lat'], 'k*', ms=14)
    plt.text(d[s]['lon'], d[s]['lat'], s)

plt.show()
Total running time of the script: (0 minutes 0.045 seconds)