Note
Go to the end to download the full example code.
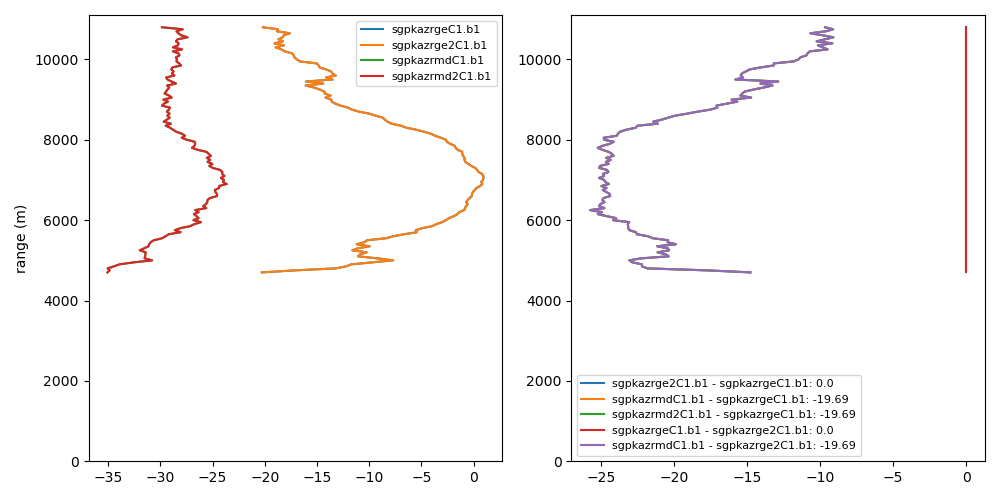
Example on how to calculate and plot average profiles
This example shows how to calculate and plot average profiles from masked data
import matplotlib.pyplot as plt
import numpy as np
from act.io.arm import read_arm_netcdf
from open_radar_data import DATASETS

import radtraq

# Read in Example KAZR File using ACT
filename = DATASETS.fetch('sgpkazrgeC1.a1.20190529.000002.cdf')
ds = read_arm_netcdf(filename)

# Resample to 1-minute to simplify processing
ds = ds.resample(time='1min').nearest()

# Process cloud mask in order to properly produce average VPT profiles through cloud
ds = radtraq.proc.cloud_mask.calc_cloud_mask(ds, 'reflectivity_copol')

# Variables to calculate average profiles
variable = ['reflectivity_copol', 'mean_doppler_velocity_copol', 'reflectivity_xpol']

# Create a grid to interpolate data onto - Needed for different radars
first_height = 1500.0
ygrid = np.arange(first_height, 15000, 50)

# Calculate average profiles
ds = radtraq.proc.profile.calc_avg_profile(
    ds, variable=variable, first_height=first_height, ygrid=ygrid
)

# Showing how to do this for multiple radars
# Set up dictionary for profile comparison plotting
rad_dict = {
    'sgpkazrgeC1.b1': {'object': ds, 'variable': variable[0]},
    'sgpkazrge2C1.b1': {'object': ds, 'variable': variable[0]},
    'sgpkazrmdC1.b1': {'object': ds, 'variable': 'reflectivity_xpol'},
    'sgpkazrmd2C1.b1': {'object': ds, 'variable': 'reflectivity_xpol'},
}

# Plot up profiles and perform comparisons from data in dictionary
display = radtraq.plotting.plot_avg_profile(rad_dict)

# Show plot
plt.show()

# Close out object
ds.close()
Total running time of the script: (0 minutes 0.707 seconds)