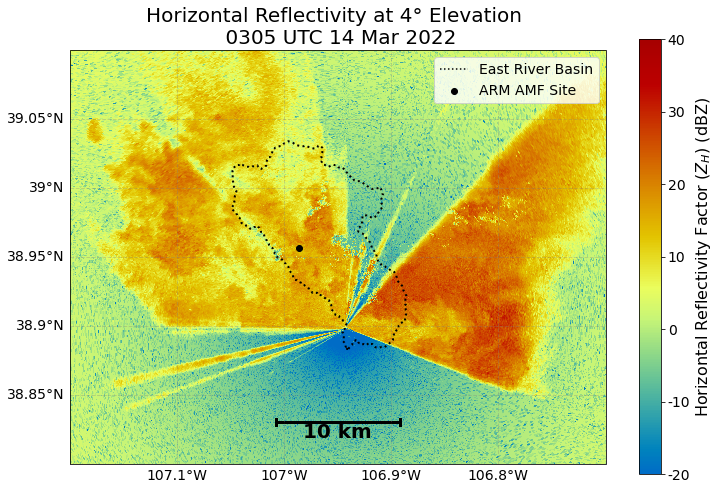
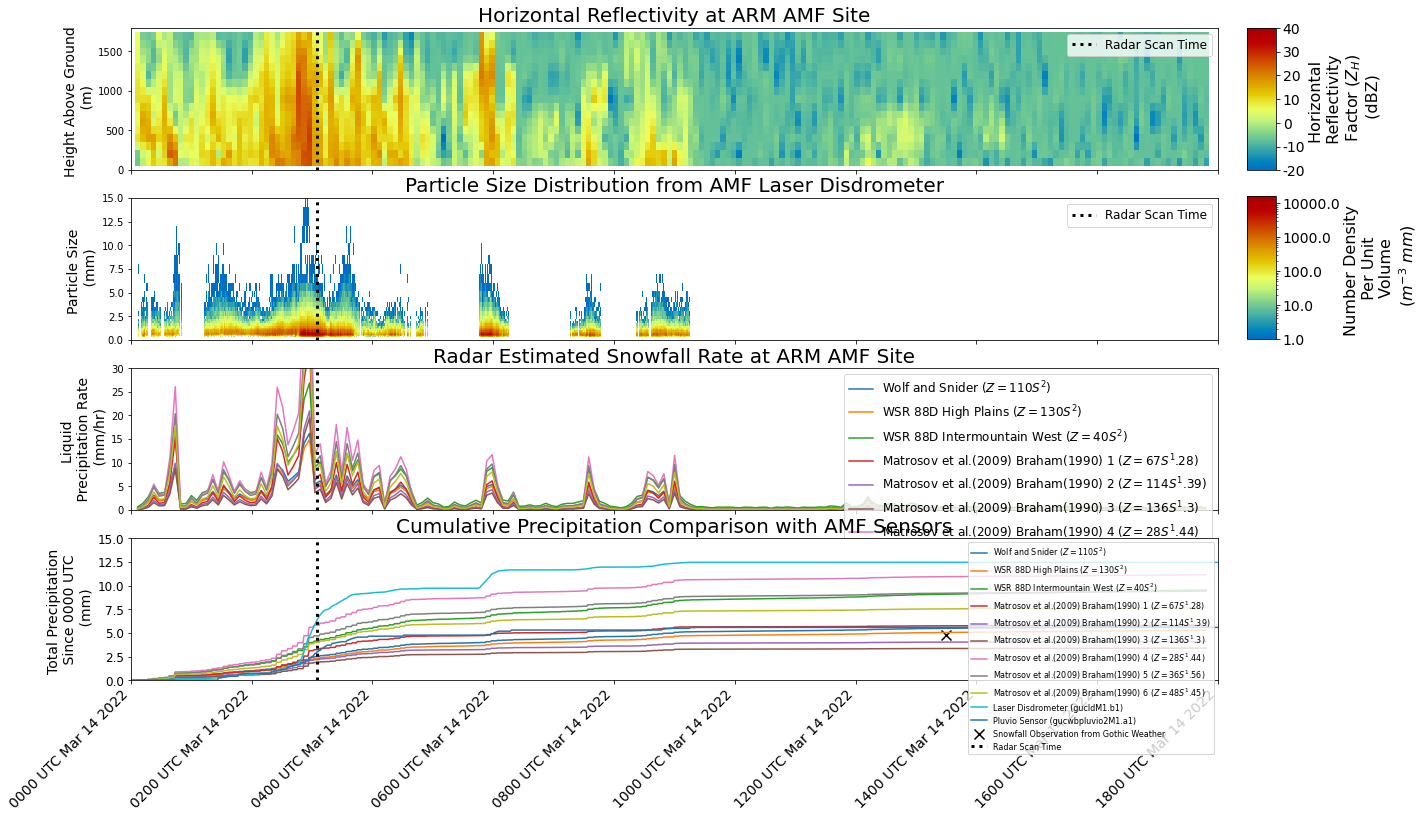
Plot a Description of the Liquid Precip Estimation Method#
Imports#
import glob
import os
import datetime

import numpy as np
import matplotlib.pyplot as plt
import pyart
import xarray as xr
import cartopy.crs as ccrs
import cartopy.feature as cfeature
from matplotlib.dates import DateFormatter
import pandas as pd
import geopandas as gpd
from metpy.plots import USCOUNTIES
from matplotlib.colors import ListedColormap
from datetime import datetime
import act
import fiona
import hvplot as hv
import hvplot.xarray
import numpy as np
from math import atan2 as atan2
from matplotlib import colors
from matplotlib import ticker, cm
fiona.drvsupport.supported_drivers['lib?kml'] = 'rw' # enable KML support which is disabled by default
fiona.drvsupport.supported_drivers['LIBKML'] = 'rw' # enable KML support which is disabled by default
hv.extension("bokeh")
Read in the Data#
Read the Watershed and Instrumentation Locations#
east_river = gpd.read_file('data/site-locations/East_River.kml')
splash_locations = gpd.read_file('data/site-locations/SPLASH_Instruments.kml')
amf_sensor_locations = gpd.read_file('data/site-locations/SAIL_Instruments.kml')
Read in the Raw Radar Data#
file_list = sorted(glob.glob("/gpfs/wolf/atm124/proj-shared/sail/202203_glued/xprecipradar_guc_volume_20220314-03*"))
file_list[:10]
['/gpfs/wolf/atm124/proj-shared/sail/202203_glued/xprecipradar_guc_volume_20220314-030359.b1.nc',
 '/gpfs/wolf/atm124/proj-shared/sail/202203_glued/xprecipradar_guc_volume_20220314-030920.b1.nc',
 '/gpfs/wolf/atm124/proj-shared/sail/202203_glued/xprecipradar_guc_volume_20220314-031440.b1.nc',
 '/gpfs/wolf/atm124/proj-shared/sail/202203_glued/xprecipradar_guc_volume_20220314-031959.b1.nc',
 '/gpfs/wolf/atm124/proj-shared/sail/202203_glued/xprecipradar_guc_volume_20220314-032520.b1.nc',
 '/gpfs/wolf/atm124/proj-shared/sail/202203_glued/xprecipradar_guc_volume_20220314-033040.b1.nc',
 '/gpfs/wolf/atm124/proj-shared/sail/202203_glued/xprecipradar_guc_volume_20220314-033600.b1.nc',
 '/gpfs/wolf/atm124/proj-shared/sail/202203_glued/xprecipradar_guc_volume_20220314-034120.b1.nc',
 '/gpfs/wolf/atm124/proj-shared/sail/202203_glued/xprecipradar_guc_volume_20220314-034640.b1.nc',
 '/gpfs/wolf/atm124/proj-shared/sail/202203_glued/xprecipradar_guc_volume_20220314-035200.b1.nc']
We can use the first file here, closes to 0300 UTC on March 14, 2022
radar = pyart.io.read(file_list[0])
radar
<pyart.core.radar.Radar at 0x7ff2580d9ac0>
Read in the Processed Radar Data Subset for the Different Instruments#
Warning
Make sure to run the “csu-xband-snowfall-march-14-2022” notebook before running this!
ds = act.io.read_netcdf("sail_snowfall_retrievals_march_14_2022.nc").sel(site="pluvio")
Download + Read Rain Gauge and Pluvio and Laser Disdrometer Data#
Make sure to register + access your ARM Live token from the ARM Live registration page
arm_username = "mgrover4"
arm_token = "##############"
start_date = "2022-03-14"
end_date = "2022-03-14"

# Access the laser disdrometer data
laser_disdrometer_files = act.discovery.download_data(username=arm_username,
                                                      token=arm_token,
                                                      datastream="gucldM1.b1",
                                                      startdate=start_date,
                                                      enddate=end_date,
                                                      output="data/laser-disdrometer/")

# Read the laser disdrometer data into an xarray dataset
laser_disdrometer_ds = act.io.read_netcdf(laser_disdrometer_files)

# Access the laser disdrometer data
pluvio_files = act.discovery.download_data(username=arm_username,
                                       token=arm_token,
                                       datastream="gucwbpluvio2M1.a1",
                                       startdate=start_date,
                                       enddate=end_date,
                                       output="data/pluvio/")

# Read the pluvio files into an xarray dataset
pluvio_ds = act.io.read_netcdf(pluvio_files)
[DOWNLOADING] gucldM1.b1.20220314.000000.cdf
[DOWNLOADING] gucwbpluvio2M1.a1.20220314.000000.nc
Apply QC Flags to both precip rates#
disdrometer_precip_rate = laser_disdrometer_ds.where(laser_disdrometer_ds.qc_precip_rate == 0).precip_rate.compute()
gauge_precip_rate = pluvio_ds.where(pluvio_ds.pluvio_status == 0).intensity_rtnrt.compute()
Calculate the Total Precipitation Rates#
disdrometer_precip_accum = act.utils.accumulate_precip(laser_disdrometer_ds.where(laser_disdrometer_ds.qc_precip_rate == 0), "precip_rate").precip_rate_accumulated.compute()
gauge_precip_accum = act.utils.accumulate_precip(pluvio_ds.where(pluvio_ds.pluvio_status == 0), "intensity_rtnrt").intensity_rtnrt_accumulated.compute()
zs_relationship_dict = {"Wolf_and_Snider":
                        {"A": 110,
                         "B": 2},
                        "WSR_88D_High_Plains":
                        {"A": 130,
                         "B": 2},
                        "WSR_88D_Intermountain_West":
                        {"A": 40,
                         "B": 2},
                        "Matrosov et al.(2009) Braham(1990) 1":
                        {"A": 67,
                         "B": 1.28},
                         "Matrosov et al.(2009) Braham(1990) 2":
                        {"A": 114,
                         "B": 1.39},
                         "Matrosov et al.(2009) Braham(1990) 3":
                        {"A": 136,
                         "B": 1.3},
                         "Matrosov et al.(2009) Braham(1990) 4":
                        {"A": 28,
                         "B": 1.44,},
                         "Matrosov et al.(2009) Braham(1990) 5":
                        {"A": 36,
                         "B": 1.56},
                         "Matrosov et al.(2009) Braham(1990) 6":
                        {"A": 48,
                         "B": 1.45},
                       }
zs_fields = list(zs_relationship_dict.keys())
ds_resampled = ds.resample(time="1T").mean().isel(height=0)
ds_resampled
<xarray.Dataset>
Dimensions:                               (time: 1063)
Coordinates:
  * time                                  (time) datetime64[ns] 2022-03-14T00...
    height                                int64 100
    site                                  <U6 'pluvio'
Data variables: (12/20)
    DBZ                                   (time) float64 dask.array<chunksize=(6,), meta=np.ndarray>
    VEL                                   (time) float64 dask.array<chunksize=(6,), meta=np.ndarray>
    WIDTH                                 (time) float64 dask.array<chunksize=(6,), meta=np.ndarray>
    ZDR                                   (time) float64 dask.array<chunksize=(6,), meta=np.ndarray>
    PHIDP                                 (time) float64 dask.array<chunksize=(6,), meta=np.ndarray>
    RHOHV                                 (time) float64 dask.array<chunksize=(6,), meta=np.ndarray>
    ...                                    ...
    Matrosov et al.(2009) Braham(1990) 1  (time) float64 dask.array<chunksize=(6,), meta=np.ndarray>
    Matrosov et al.(2009) Braham(1990) 2  (time) float64 dask.array<chunksize=(6,), meta=np.ndarray>
    Matrosov et al.(2009) Braham(1990) 3  (time) float64 dask.array<chunksize=(6,), meta=np.ndarray>
    Matrosov et al.(2009) Braham(1990) 4  (time) float64 dask.array<chunksize=(6,), meta=np.ndarray>
    Matrosov et al.(2009) Braham(1990) 5  (time) float64 dask.array<chunksize=(6,), meta=np.ndarray>
Matrosov et al.(2009) Braham(1990) 6 (time) float64 dask.array<chunksize=(6,), meta=np.ndarray>for field in zs_fields:
ds_resampled[field].attrs["units"] = "mm/hr"
ds_resampled = act.utils.accumulate_precip(ds_resampled, field)
Setup Helper Functions#
We need these helper functions to create the scale bar within our figure
def gc_latlon_bear_dist(lat1, lon1, bear, dist):
    """
    Input lat1/lon1 as decimal degrees, as well as bearing and distance from
    the coordinate. Returns lat2/lon2 of final destination. Cannot be
    vectorized due to atan2.
    """
    re = 6371.1  # km
    lat1r = np.deg2rad(lat1)
    lon1r = np.deg2rad(lon1)
    bearr = np.deg2rad(bear)
    lat2r = np.arcsin((np.sin(lat1r) * np.cos(dist/re)) +
                      (np.cos(lat1r) * np.sin(dist/re) * np.cos(bearr)))
    lon2r = lon1r + atan2(np.sin(bearr) * np.sin(dist/re) *
                          np.cos(lat1r), np.cos(dist/re) - np.sin(lat1r) *
                          np.sin(lat2r))
    return np.rad2deg(lat2r), np.rad2deg(lon2r)


def add_scale_line(scale, ax, projection, color='k',
                  linewidth=None, fontsize=None, fontweight=None):
    """
    Adds a line that shows the map scale in km. The line will automatically
    scale based on zoom level of the map. Works with cartopy.

    Parameters
    ----------
    scale : scalar
        Length of line to draw, in km.
    ax : matplotlib.pyplot.Axes instance
        Axes instance to draw line on. It is assumed that this was created
        with a map projection.
    projection : cartopy.crs projection
        Cartopy projection being used in the plot.

    Other Parameters
    ----------------
    color : str
        Color of line and text to draw. Default is black.
    """
    frac_lat = 0.1  # distance fraction from bottom of plot
    frac_lon = 0.5  # distance fraction from left of plot
    e1 = ax.get_extent()
    center_lon = e1[0] + frac_lon * (e1[1] - e1[0])
    center_lat = e1[2] + frac_lat * (e1[3] - e1[2])
    # Main line
    lat1, lon1 = gc_latlon_bear_dist(
        center_lat, center_lon, -90, scale / 2.0)  # left point
    lat2, lon2 = gc_latlon_bear_dist(
        center_lat, center_lon, 90, scale / 2.0)  # right point
    if lon1 <= e1[0] or lon2 >= e1[1]:
        warnings.warn('Scale line longer than extent of plot! ' +
                      'Try shortening for best effect.')
    ax.plot([lon1, lon2], [lat1, lat2], linestyle='-',
            color=color, transform=projection,
            linewidth=linewidth)
    # Draw a vertical hash on the left edge
    lat1a, lon1a = gc_latlon_bear_dist(
        lat1, lon1, 180, frac_lon * scale / 20.0)  # bottom left hash
    lat1b, lon1b = gc_latlon_bear_dist(
        lat1, lon1, 0, frac_lon * scale / 20.0)  # top left hash
    ax.plot([lon1a, lon1b], [lat1a, lat1b], linestyle='-',
            color=color, transform=projection, linewidth=linewidth)
    # Draw a vertical hash on the right edge
    lat2a, lon2a = gc_latlon_bear_dist(
        lat2, lon2, 180, frac_lon * scale / 20.0)  # bottom right hash
    lat2b, lon2b = gc_latlon_bear_dist(
        lat2, lon2, 0, frac_lon * scale / 20.0)  # top right hash
    ax.plot([lon2a, lon2b], [lat2a, lat2b], linestyle='-',
            color=color, transform=projection, linewidth=linewidth)
    # Draw scale label
    ax.text(center_lon, center_lat - frac_lat * (e1[3] - e1[2]) / 4.0,
            str(int(scale)) + ' km', horizontalalignment='center',
            verticalalignment='center', color=color, fontweight=fontweight,
            fontsize=fontsize)
Plot the Reflectivity with the Pluvio Sensor and Watershed Locations#
fig = plt.figure(figsize=(12,8))

ax = plt.subplot(111,
                 projection=ccrs.PlateCarree())

min_lat = 38.8
max_lat = 39.1
min_lon = -107.2
max_lon = -106.7

#Setup a RadarMapDisplay, which gives our axes in lat/lon
display = pyart.graph.RadarMapDisplay(radar)

# Add our reflectivity (DBZ) field to the plot, including our gatefilter
radar_plot = display.plot_ppi_map('DBZ',
                                  2,
                                  ax=ax,
                                  vmin=-20,
                                  min_lat=min_lat,
                                  max_lat=max_lat,
                                  min_lon=min_lon,
                                  max_lon=max_lon,
                                  embelish=False,
                                  colorbar_label="Horizontal Reflectivity Factor ($Z_{H}$) \n (dBZ)",
                                  vmax=40.,)

cbar = display.cbs[0]
cbar.set_ticklabels(np.arange(-20, 50, 10), fontsize=14)
cbar.set_label(label='Horizontal Reflectivity Factor ($Z_{H}$) (dBZ)', fontsize=16)

display.cbs = [cbar]


east_river.plot(ax=ax,
                linewidth=2,
                edgecolor='k',
                facecolor="None",
                linestyle=':',)

ax.plot(0,
        0,
        color='k',
        linestyle=':',
        label='East River Basin')

amf_sensor_locations.loc[amf_sensor_locations.Name == 'PLUVIO'].plot(ax=ax,
                                                                     color='k',
                                                                     label='ARM AMF Site')

plt.legend(loc='upper right',
           fontsize=14)

plt.xlim(min_lon, max_lon)
plt.ylim(min_lat, max_lat)

# Add our scale bar
add_scale_line(10.0, ax, projection=ccrs.PlateCarree(),
               color='black', linewidth=3,
               fontsize=20,
               fontweight='bold')

# Add gridlines
gl = ax.gridlines(crs=ccrs.PlateCarree(),
                   draw_labels=True,
                   linewidth=1,
                   color='gray',
                   alpha=0.3,
                   linestyle='--')

plt.gca().xaxis.set_major_locator(plt.NullLocator())

# Make sure labels are only plotted on the left and bottom
gl.xlabels_top = False
gl.ylabels_right = False

gl.xlabel_style = {'size': 14}
gl.ylabel_style = {'size': 14}

third_sweep = radar.extract_sweeps([2])
time = pd.to_datetime(third_sweep.time["data"], unit='s').mean()
time_in_label = time.strftime("%H%M UTC %d %b %Y")

plt.title(f"Horizontal Reflectivity at 4° Elevation \n {time_in_label}", fontsize=20)

plt.savefig("ppi_4deg_march14_0300.png", dpi=300, bbox_inches="tight")

plt.show()
/tmp/ipykernel_187/1384334602.py:28: UserWarning: FixedFormatter should only be used together with FixedLocator
cbar.set_ticklabels(np.arange(-20, 50, 10), fontsize=14)
/ccsopen/home/mgrover/mgrover/sail-radar-dev/lib/python3.9/site-packages/geopandas/plotting.py:74: DeprecationWarning: distutils Version classes are deprecated. Use packaging.version instead.
if mpl >= LooseVersion("3.4") or (mpl > LooseVersion("3.3.2") and "+" in mpl):
/ccsopen/home/mgrover/mgrover/sail-radar-dev/lib/python3.9/site-packages/setuptools/_distutils/version.py:351: DeprecationWarning: distutils Version classes are deprecated. Use packaging.version instead.
other = LooseVersion(other)
/ccsopen/home/mgrover/mgrover/sail-radar-dev/lib/python3.9/site-packages/cartopy/mpl/gridliner.py:451: UserWarning: The .xlabels_top attribute is deprecated. Please use .top_labels to toggle visibility instead.
warnings.warn('The .xlabels_top attribute is deprecated. Please '
/ccsopen/home/mgrover/mgrover/sail-radar-dev/lib/python3.9/site-packages/cartopy/mpl/gridliner.py:487: UserWarning: The .ylabels_right attribute is deprecated. Please use .right_labels to toggle visibility instead.
warnings.warn('The .ylabels_right attribute is deprecated. Please '

Plot a Timeseries of Reflectivity and Snowfall at the Pluvio Sensor#
fig, (ax1, ax2, ax3, ax4) = plt.subplots(4, 1, sharex=True, sharey=False, figsize=(20,12))
time_min = datetime(2022, 3, 14, 0)
time_max = datetime(2022, 3, 14, 18)


ds_at_site = ds.dropna(dim='height')

date_form = DateFormatter("%H%M UTC %b %d %Y")

dbz_plot = ds.DBZ.plot(cmap='pyart_HomeyerRainbow',
                       vmin=-20,
                       vmax=40,
                       ax=ax1,
                       add_colorbar=False,
                       figure=fig,
                       x='time')


ax1.set_ylim(0, 1800)
ax1.set_ylabel("Height Above Ground \n (m)", fontsize=14)
ax1.set_xlabel("")

ax1.set_title(f'Horizontal Reflectivity at ARM AMF Site', fontsize=20)


ax1.xaxis.set_major_formatter(date_form)
ax1.axvline(datetime(2022, 3, 14, 3, 5),
            linewidth=3,
            color='k',
            linestyle=':',
            label='Radar Scan Time')

ax1.legend(loc='upper right', fontsize=12)

date_form = DateFormatter("%H%M UTC %b %d %Y")
ax1.set_xlim(time_min, time_max)

# Drop Size Distribution
norm = colors.LogNorm(vmin=laser_disdrometer_ds.number_density_drops.values.min()+1,
                      vmax=laser_disdrometer_ds.number_density_drops.values.max())

dsd_plot = laser_disdrometer_ds.sel(time=slice("2022-03-14T00",
                                               "2022-03-14T17")).number_density_drops.plot(x="time",
                                                                                          y="particle_size",
                                                                                          norm=norm,
                                                                                          cmap="pyart_HomeyerRainbow",
                                                                                          add_colorbar=False,
                                                                                          ax=ax2)
ax2.set_ylim(0, 15)
ax2.axvline(datetime(2022, 3, 14, 3, 5),
            linewidth=3,
            color='k',
            linestyle=':',
            label='Radar Scan Time')
ax2.legend(loc='upper right', fontsize=12)
ax2.set_ylabel("Particle Size \n (mm)", fontsize=14)
ax2.set_xlabel("")
ax2.set_title(f'Particle Size Distribution from AMF Laser Disdrometer', fontsize=20)
ax2.set_xlim(time_min, time_max)

### Particle Size Distributions
site_name = ds_at_site.site.values
for relationship in zs_relationship_dict.keys():
    relationship_name = relationship.replace("_", " ")
    a_coefficeint = ds[relationship].A
    b_coefficeint = ds[relationship].B
    relationship_equation = f"$Z = {a_coefficeint}S^{b_coefficeint}$"

    ds_at_site.isel(height=0)[relationship].plot(label=f'{relationship_name} ({relationship_equation})',
                                                 ax=ax3)
    ax3.xaxis.set_major_formatter(date_form)


ax3.set_title(f"Radar Estimated Snowfall Rate at ARM AMF Site", fontsize=20)

ax3.axvline(datetime(2022, 3, 14, 3, 5),
            linewidth=3,
            color='k',
            linestyle=':',
            label='Radar Scan Time')

ax3.legend(loc='upper right', fontsize=12)
ax3.set_xlabel("")
ax3.set_ylabel("Liquid \n Precipitation Rate \n (mm/hr)", fontsize=14)
ax3.set_ylim(0, 30)
ax3.set_xlim(time_min, time_max)

# Instrument Intercomparison

#disdrometer_precip_rate.plot(ax=ax3,
#                             label= f"Laser Disdrometer ({laser_disdrometer_ds.datastream})",)
#
#gauge_precip_rate.plot(ax=ax3,
#                       label=f"Pluvio Sensor ({pluvio_ds.datastream})")
#
#ax3.set_title(f"ARM AMF Site Precipitation Instrument Comparison", fontsize=20)
#
#ax3.xaxis.set_major_formatter(date_form)
#ax3.axvline(datetime(2022, 3, 14, 3, 5),
#            linewidth=3,
#            color='k',
#            linestyle=':',
#            label='Radar Scan Time')


#ax3.legend(loc='upper right', fontsize=12)
#ax3.set_xlabel("")
#ax3.set_ylabel("Liquid \n Precipitation Rate \n (mm/hr)", fontsize=14)
#ax3.set_ylim(0, 30)

site_name = ds_at_site.site.values
for relationship in zs_relationship_dict.keys():
    relationship_name = relationship.replace("_", " ")
    a_coefficeint = ds[relationship].A
    b_coefficeint = ds[relationship].B
    relationship_equation = f"$Z = {a_coefficeint}S^{b_coefficeint}$"

    (ds_resampled[relationship+"_accumulated"]).plot(label=f'{relationship_name} ({relationship_equation})',
                                                   ax=ax4)
    ax4.xaxis.set_major_formatter(date_form)


disdrometer_precip_accum.plot(ax=ax4,
                              label= f"Laser Disdrometer ({laser_disdrometer_ds.datastream})",
                             )

gauge_precip_accum.plot(ax=ax4,
                        label=f"Pluvio Sensor ({pluvio_ds.datastream})"
                       )

ax4.set_title(f"Cumulative Precipitation Comparison with AMF Sensors", fontsize=20)

ax4.scatter(datetime(2022, 3, 14, 13, 30),
            4.826,
            c="k",
            s=100,
            marker="x",
            label="Snowfall Observation from Gothic Weather")

ax4.axvline(datetime(2022, 3, 14, 3, 5),
            linewidth=3,
            color='k',
            linestyle=':',
            label='Radar Scan Time')
ax4.set_xlim(time_min, time_max)

plt.legend(loc='upper right', fontsize=8)
plt.xlabel("")
plt.ylabel("Total Precipitation \n Since 0000 UTC \n (mm)", fontsize=14)
plt.xticks(fontsize=14, rotation=45)
plt.yticks(fontsize=12)
plt.ylim(0, 15)

# Reflectivity colorbar
fig.subplots_adjust(right=0.88)
cbar_ax = fig.add_axes([0.9, 0.715, 0.02, 0.165])
cbar = fig.colorbar(dbz_plot, orientation="vertical", ax=ax1, cax=cbar_ax)
cbar.set_ticklabels(np.arange(-20, 50, 10), fontsize=14)
cbar.set_label(label='Horizontal \n Reflectivity \n Factor ($Z_{H}$) \n (dBZ)', fontsize=16)

# Particle Size Distribution colorbar
fig.subplots_adjust(right=0.88)
cbar_ax2 = fig.add_axes([0.9, 0.52, 0.02, 0.165])
cbar2 = fig.colorbar(dsd_plot, orientation="vertical", ax=ax2, cax=cbar_ax2)
cbar2.set_ticklabels(cbar2.get_ticks(), fontsize=14)
cbar2.set_label(label='Number Density \n Per Unit \n Volume \n ($m^{-3}$ $mm$)', fontsize=16)

plt.savefig("ppi_precip_estimate_pluvio.png", bbox_inches="tight", dpi=300)
/tmp/ipykernel_187/592557654.py:162: UserWarning: FixedFormatter should only be used together with FixedLocator
  cbar.set_ticklabels(np.arange(-20, 50, 10), fontsize=14)
/tmp/ipykernel_187/592557654.py:169: UserWarning: FixedFormatter should only be used together with FixedLocator
  cbar2.set_ticklabels(cbar2.get_ticks(), fontsize=14)

Interactive DSD Plot#
from bokeh.models import DatetimeTickFormatter

def apply_formatter(plot, element):
    plot.handles['xaxis'].formatter = DatetimeTickFormatter(hours='%m/%d/%Y \n %H:%M',
                                                            minutes='%m/%d/%Y \n %H:%M',
                                                            hourmin='%m/%d/%Y \n %H:%M',
                                                            days='%m/%d/%Y \n %H:%M',
                                                            months='%m/%d/%Y \n %H:%M')

laser_disdrometer_ds.number_density_drops.hvplot(x="time", y="particle_size", cnorm="log", clim=(0, 10_000), cmap="pyart_HomeyerRainbow").opts(hooks=[apply_formatter])
WARNING:param.Image01564: Image dimension particle_size is not evenly sampled to relative tolerance of 0.001. Please use the QuadMesh element for irregularly sampled data or set a higher tolerance on hv.config.image_rtol or the rtol parameter in the Image constructor.
WARNING:param.Image01564: Image dimension particle_size is not evenly sampled to relative tolerance of 0.001. Please use the QuadMesh element for irregularly sampled data or set a higher tolerance on hv.config.image_rtol or the rtol parameter in the Image constructor.
/ccsopen/home/mgrover/mgrover/sail-radar-dev/lib/python3.9/site-packages/bokeh/core/property/bases.py:259: DeprecationWarning: elementwise comparison failed; this will raise an error in the future.
  return new == old
/ccsopen/home/mgrover/mgrover/sail-radar-dev/lib/python3.9/site-packages/bokeh/core/property/bases.py:259: DeprecationWarning: elementwise comparison failed; this will raise an error in the future.
  return new == old

