In this example, we walk though how to check the calibration between the X-band and Ka-Band radars
Imports
import pyart
import act
import glob
import matplotlib.pyplot as plt
import xarray as xr
from datetime import datetime
from matplotlib.dates import DateFormatter
Download the KAZR data
We can access the Ka-band (KAZR) data from the ARM data portal
kazr_files = act.discovery.download_data("mgrover4",
                                         "#############",
                                         "guckazrcfrcorgeM1.c0",
                                         "2022-03-14",
                                         "2022-03-14")
[DOWNLOADING] guckazrcfrcorgeM1.c0.20220314.000001.nc
We have glued the original xband radar files, and stored these on the local file system in the path below
xprecip_files = sorted(glob.glob("/gpfs/wolf/atm124/proj-shared/sail/202203_glued/xprecipradar_guc_volume_20220314-03*"))Load in the Data
Let’s work with the xarray datasets!
kazr_radar = act.io.read_netcdf(kazr_files)

# this was output from the csu-xband-snowfall-march-14-2022 notebook
xband_ds = xr.open_dataset("sail_snowfall_retrievals_march_14_2022.nc")
We also need to apply the quality flags before working with the kazr data
kazr_lowest_reflectivity = kazr_radar.where(kazr_radar.qc_reflectivity != 1).isel(range=2)[['reflectivity']]Setup Functions to Calculate Snowfall
def snow_rate_from_ds(ds, swe_ratio, A, B, snow_field_name="snow_z", reflectivity_field='DBZ'):
    """
    Snow rate applied to an Xarray.Dataset

    Takes a given Snow Water Equivilent ratio (SWE_ratio), A and B value
    for the Z-S relationship and creates a radar field similar to DBZ
    showing the radar estimated snowfall rate in mm/hr. Then the given
    SWE_ratio, A and B are stored in the radar metadata for later
    reference.
    """
    snow_z = ds[reflectivity_field].copy()

    # Convert it from dB to linear units
    z_lin = 10.0**(snow_z/10.)

    # Apply the Z-S relation.
    snow_z = swe_ratio * (z_lin/A)**(1./B)

    ds[snow_field_name] = snow_z

    field_attrs = {"units": "mm/hr",
                   "standard_name": "snowfall_rate",
                   "long_name":"snowfall_rate_from_z",
                   "valid_min":0,
                   "valid_max":500,
                   "swe_ratio":swe_ratio,
                   "A":A,
                   "B":B}

    ds[snow_field_name].attrs = field_attrs

    return ds
zs_relationship_dict = {"Wolf_and_Snider":
{"A": 110,
"B": 2},
"WSR_88D_High_Plains":
{"A": 130,
"B": 2},
"WSR_88D_Intermountain_West":
{"A": 40,
"B": 2},
"Matrosov et al.(2009) Braham(1990) 1":
{"A": 67,
"B": 1.28},
"Matrosov et al.(2009) Braham(1990) 2":
{"A": 114,
"B": 1.39},
"Matrosov et al.(2009) Braham(1990) 3":
{"A": 136,
"B": 1.3},
"Matrosov et al.(2009) Braham(1990) 4":
{"A": 28,
"B": 1.44,},
"Matrosov et al.(2009) Braham(1990) 5":
{"A": 36,
"B": 1.56},
"Matrosov et al.(2009) Braham(1990) 6":
{"A": 48,
"B": 1.45},
}Apply the Z(S) relationships
We can now apply our z-s relationships to our dataset
for relationship in zs_relationship_dict.keys():
    snow_rate_from_ds(kazr_lowest_reflectivity,
                      8.5,
                      zs_relationship_dict[relationship]["A"],
                      zs_relationship_dict[relationship]["B"],
                      snow_field_name=relationship,
                      reflectivity_field='reflectivity')
ds = kazr_lowest_reflectivityCalculate Accumulated Snowfall
zs_fields = list(zs_relationship_dict.keys())ds_resampled = ds.resample(time="1T").mean()for field in zs_fields:
ds_resampled[field].attrs["units"] = "mm/hr"
ds_resampled = act.utils.accumulate_precip(ds_resampled, field)Plot a Reflectivity Comparison
xband_ref = xband_ds.sel(site='pluvio').isel(height=0).DBZ.resample(time='1T').mean().dropna('time')
kaband_ref = ds_resampled.reflectivity
difference = (kaband_ref - xband_ref)Plot Both Reflectivity Values
xband_ref.plot(label='X-Band Reflectivity')
kaband_ref.plot(label='KAZR Reflectivity')
plt.legend()
plt.title('')
plt.xlim('2022-03-14T00', '2022-03-14T09')
plt.savefig("kazr_xband_ref.png", dpi=300)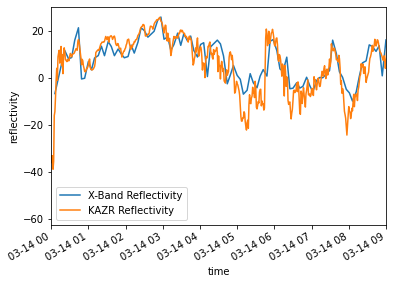
Plot the Difference in Reflectivity
difference.plot()
plt.title('KAZR - X-Band Reflectivity')
plt.ylabel('Reflectivity (dB)')
plt.xlim('2022-03-14T00', '2022-03-14T09')
plt.ylim(-20, 20)
(-20.0, 20.0)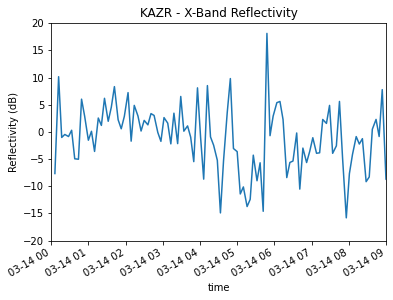
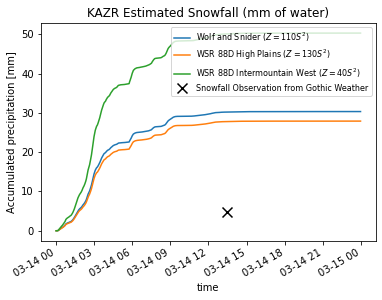
Compare Snowfall Totals with Gothic Weather Station
The observation here is from the Gothic wx site, using the liquid precipitation value from March 14, 2022 https://
date_form = DateFormatter("%H%M UTC %b %d %Y")

for relationship in list(zs_relationship_dict.keys())[:3]:
    relationship_name = relationship.replace("_", " ")
    a_coefficeint = ds[relationship].A
    b_coefficeint = ds[relationship].B
    relationship_equation = f"$Z = {a_coefficeint}S^{b_coefficeint}$"

    (ds_resampled[relationship+"_accumulated"]).plot(label=f'{relationship_name} ({relationship_equation})')
    ax.xaxis.set_major_formatter(date_form)

plt.scatter(datetime(2022, 3, 14, 13, 30),
            4.826,
            c="k",
            s=100,
            marker="x",
            label="Snowfall Observation from Gothic Weather")

plt.legend(loc='upper right', fontsize=8)
plt.title("KAZR Estimated Snowfall (mm of water)")
plt.savefig("kazr_snowfall.png", dpi=300)