Comparing DBZ, ZDR and KDP (LP and Maesaka) methods.
import pyart
import glob
import matplotlib.pyplot as plt
import cartopy.crs as ccrs
import numpy as np
import sys
import fiona
import geopandas as gpd
fiona.drvsupport.supported_drivers['lib?kml'] = 'rw' # enable KML support which is disabled by default
fiona.drvsupport.supported_drivers['LIBKML'] = 'rw' # enable KML support which is disabled by default
## You are using the Python ARM Radar Toolkit (Py-ART), an open source
## library for working with weather radar data. Py-ART is partly
## supported by the U.S. Department of Energy as part of the Atmospheric
## Radiation Measurement (ARM) Climate Research Facility, an Office of
## Science user facility.
##
## If you use this software to prepare a publication, please cite:
##
##     JJ Helmus and SM Collis, JORS 2016, doi: 10.5334/jors.119
<frozen importlib._bootstrap>:283: DeprecationWarning: the load_module() method is deprecated and slated for removal in Python 3.12; use exec_module() instead
ERROR 1: PROJ: proj_create_from_database: Open of /ccsopen/home/braut/analysis-env2/share/proj failed
Select files
We are only reading a single sweep from a file with high rain rate.
hour = '19'
day = '25'
month = '08'
year = '2022'

files = sorted(glob.glob(f'/gpfs/wolf/atm124/proj-shared/gucxprecipradarS2.00/glue_files/{year}{month}_glued/xprecipradar_guc_volume_{year}{month}{day}-{hour}*'))

radar = pyart.io.read(files[-3])
radar = radar.extract_sweeps([0])
display = pyart.graph.RadarDisplay(radar)
display.plot('DBZ')
plt.xlim(-20, 20)
plt.ylim(-20, 20)(-20.0, 20.0)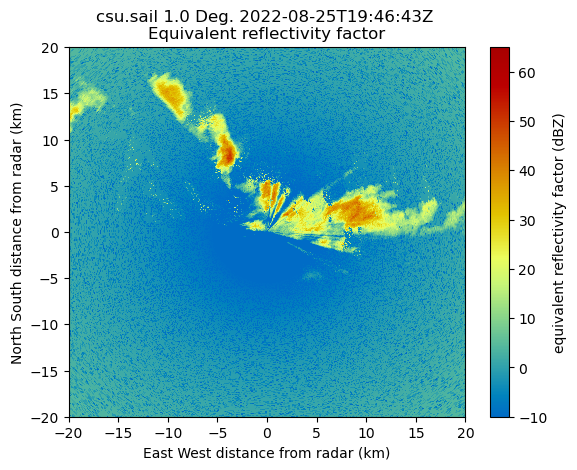
Create gatefilter
nyquist_value = radar.fields['VEL']['data'].max()
vel_texture = pyart.retrieve.calculate_velocity_texture(radar,
                                                        vel_field='VEL',
                                                        nyq=nyquist_value)

radar.add_field('velocity_texture', vel_texture, replace_existing=True)

phidp_texture = pyart.retrieve.texture_of_complex_phase(radar, phidp_field='PHIDP', phidp_texture_field='phidp_texture')

radar.add_field('phidp_texture', phidp_texture, replace_existing=True)

gatefilter = pyart.filters.GateFilter(radar)
gatefilter.exclude_above('phidp_texture', 30)
gatefilter.exclude_above('velocity_texture', 10)
Compute KDP using Maesaka method
kdp, _for_kdp, r_kdp = pyart.retrieve.kdp_maesaka(radar, gatefilter=gatefilter, refl_field='DBZhv',
                                                  psidp_field='PHIDP')
radar.fields['KDP_maesaka']=kdp
/ccsopen/home/braut/analysis-env2/lib/python3.10/site-packages/numpy/core/fromnumeric.py:758: UserWarning: Warning: 'partition' will ignore the 'mask' of the MaskedArray.
  a.partition(kth, axis=axis, kind=kind, order=order)
Compute KDP using Giangrande LP method
PHIDP_LP, KDP_LP = pyart.correct.phase_proc_lp(radar, 0.0,
                                                   ncp_field='NCP',
                                                   refl_field='DBZ',
                                                   rhv_field='RHOHV',
                                                   phidp_field='PHIDP')

radar.fields['PHIDP_LP']=PHIDP_LP
radar.fields['KDP_LP']=KDP_LP
Get the fields in Numpy array
Add offset to ZDR
dbz = radar.fields['DBZ']['data']
zdr = radar.fields['ZDR']['data']+2
kdp_maesaka = radar.fields['KDP_maesaka']['data']
kdp_lp = radar.fields['KDP_LP']['data']
figure = plt.figure(figsize=(15, 4))
ax1=plt.subplot(1, 3, 1)
display = pyart.graph.RadarDisplay(radar)
display.plot('KDP_LP', ax=ax1, vmin=0, vmax=4, cmap='pyart_Carbone42',)
plt.xlim(-20, 20)
plt.ylim(-20, 20)
ax2=plt.subplot(1, 3, 2)
display.plot('KDP_maesaka', ax=ax2, vmin=0, vmax=4, cmap='pyart_Carbone42',)
plt.xlim(-20, 20)
plt.ylim(-20, 20)
ax3=plt.subplot(1, 3, 3)
display.plot('DBZ', ax=ax3)
plt.xlim(-20, 20)
plt.ylim(-20, 20)(-20.0, 20.0)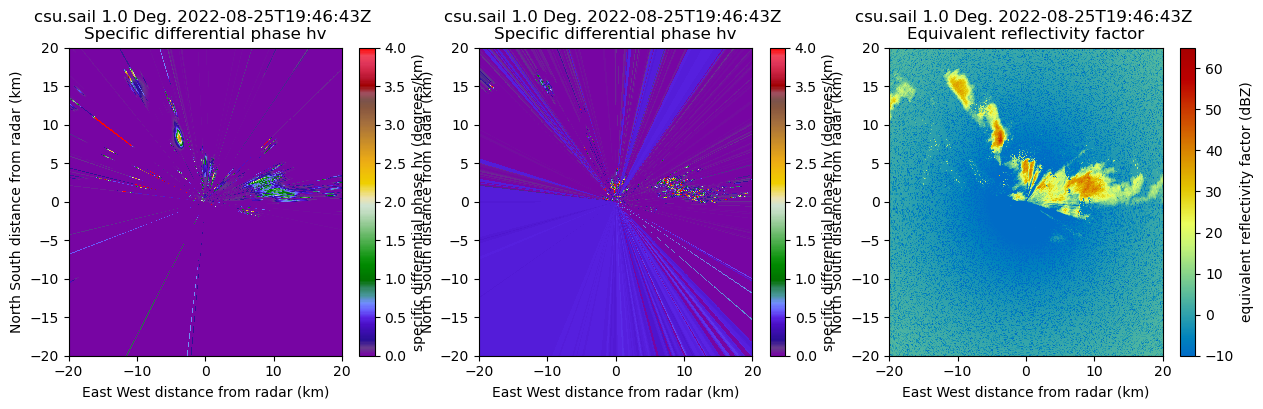
Select reasonable DBZ range
dbz = dbz.flatten()
zdr = zdr.flatten()
kdp_lp = kdp_lp.flatten()
kdp_maesaka = kdp_maesaka.flatten()

dbz_sel = dbz[(dbz>10) * (dbz<60)]
zdr_sel = zdr[(dbz>10) * (dbz<60)]
kdp_lp_sel = kdp_lp[(dbz>10) * (dbz<60)]
kdp_maesaka_sel = kdp_maesaka[(dbz>10) * (dbz<60)]
Plot Distributions
fig, ax = plt.subplots(1, 4, figsize=(15, 4))
ax[0].hist(dbz_sel, range=(0, 50), bins=50)
ax[0].set_title('a) DBZ')
ax[0].grid()
ax[1].hist(zdr_sel, range=(-2, 6), bins=20)
ax[1].set_title('b) ZDR')
ax[1].grid()
ax[2].hist(kdp_lp_sel, range=(0, 4), bins=20)
ax[2].set_title('c) KDP_LP')
ax[2].grid()
ax[3].hist(kdp_maesaka_sel, range=(0, 4), bins=20)
ax[3].set_title('d) KDP_Maesaka')
ax[3].grid()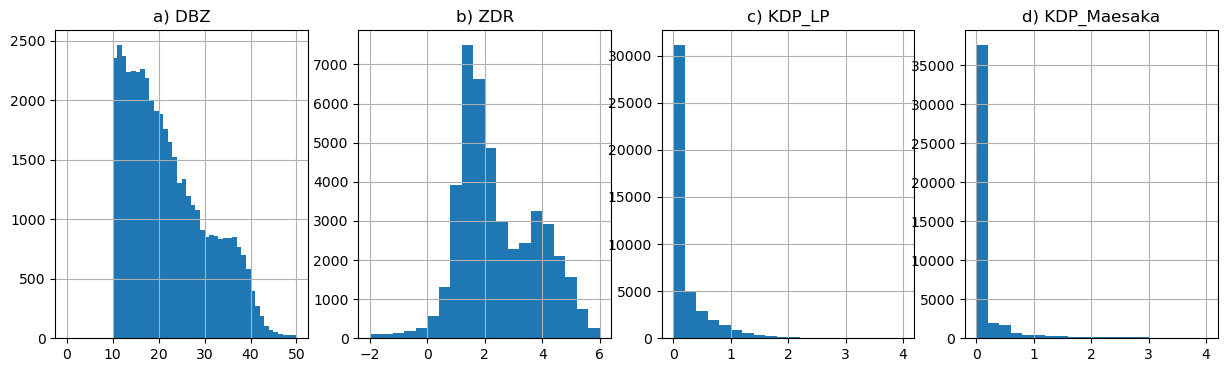
Plot selected points
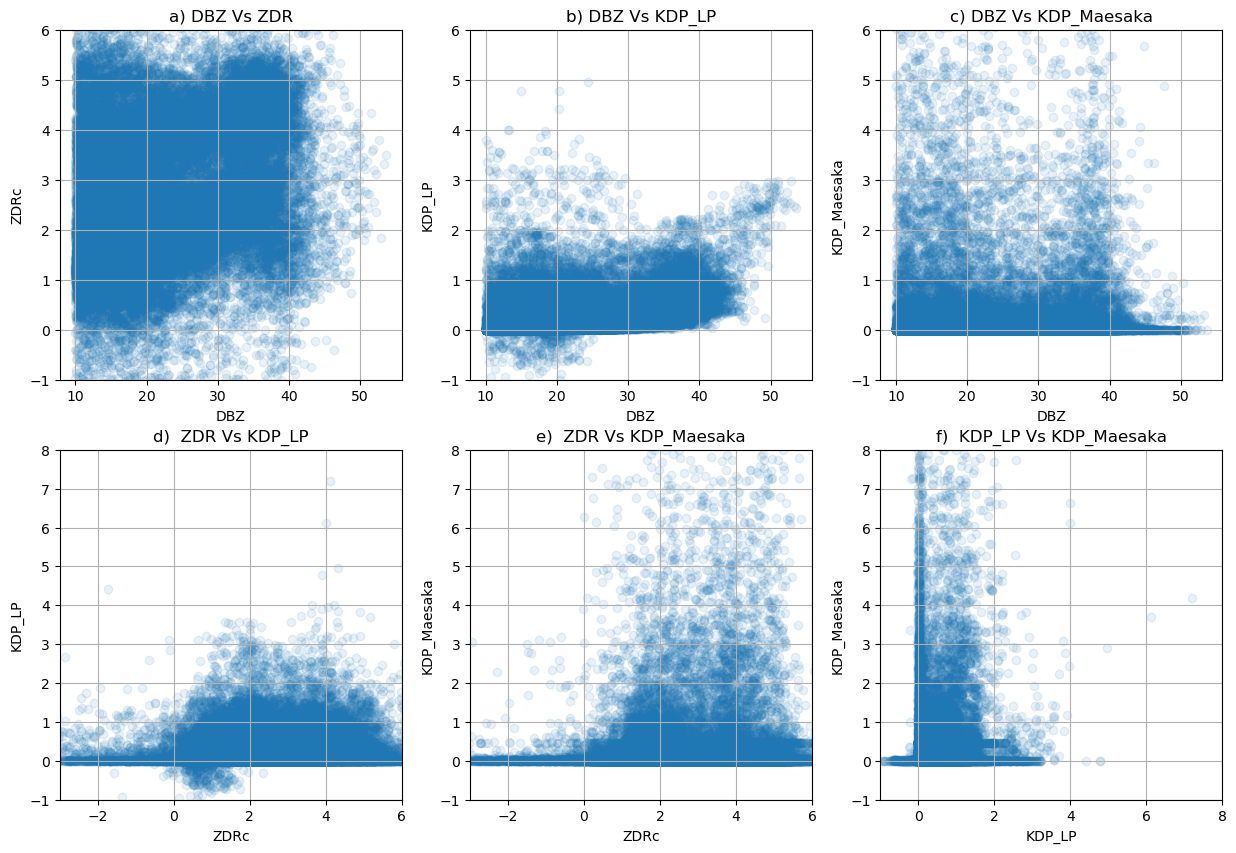
fig, ax = plt.subplots(2, 3, figsize=(15, 10))
ax[0, 0].scatter(dbz_sel, zdr_sel, alpha=0.1)
ax[0, 0].set_ylim(-1, 6)
ax[0, 0].set_xlabel('DBZ')
ax[0, 0].set_ylabel('ZDRc')
ax[0, 0].set_title('a) DBZ Vs ZDR')
ax[0, 0].grid()

ax[0, 1].scatter(dbz_sel, kdp_lp_sel, alpha=0.1)
ax[0, 1].set_ylim(-1, 6)
ax[0, 1].set_xlabel('DBZ')
ax[0, 1].set_ylabel('KDP_LP')
ax[0, 1].set_title('b) DBZ Vs KDP_LP')
ax[0, 1].grid()

ax[0, 2].scatter(dbz_sel, kdp_maesaka_sel, alpha=0.1)
ax[0, 2].set_ylim(-1, 6)
ax[0, 2].set_xlabel('DBZ')
ax[0, 2].set_ylabel('KDP_Maesaka')
ax[0, 2].set_title('c) DBZ Vs KDP_Maesaka')
ax[0, 2].grid()

ax[1, 0].scatter(zdr_sel, kdp_lp_sel,  alpha=0.1)
ax[1, 0].set_ylim(-1, 8)
ax[1, 0].set_xlim(-3, 6)
ax[1, 0].set_xlabel('ZDRc')
ax[1, 0].set_ylabel('KDP_LP')
ax[1, 0].set_title('d)  ZDR Vs KDP_LP')
ax[1, 0].grid()

ax[1, 1].scatter(zdr_sel, kdp_maesaka_sel, alpha=0.1)
ax[1, 1].set_ylim(-1, 8)
ax[1, 1].set_xlim(-3, 6)
ax[1, 1].set_xlabel('ZDRc')
ax[1, 1].set_ylabel('KDP_Maesaka')
ax[1, 1].set_title('e)  ZDR Vs KDP_Maesaka')
ax[1, 1].grid()

ax[1, 2].scatter(kdp_lp_sel, kdp_maesaka_sel, alpha=0.1)
ax[1, 2].set_ylim(-1, 8)
ax[1, 2].set_xlim(-1, 8)
ax[1, 2].set_xlabel('KDP_LP')
ax[1, 2].set_ylabel('KDP_Maesaka')
ax[1, 2].set_title('f)  KDP_LP Vs KDP_Maesaka')
ax[1, 2].grid()
(45296,)