Imports
import pyart
import matplotlib.pyplot as plt
import numpy as np
import glob
import act
from pathlib import Path
## You are using the Python ARM Radar Toolkit (Py-ART), an open source
## library for working with weather radar data. Py-ART is partly
## supported by the U.S. Department of Energy as part of the Atmospheric
## Radiation Measurement (ARM) Climate Research Facility, an Office of
## Science user facility.
##
## If you use this software to prepare a publication, please cite:
##
##     JJ Helmus and SM Collis, JORS 2016, doi: 10.5334/jors.119
cmac_files = sorted(glob.glob("data/cmac/*"))
cmac_files['data/cmac/bnfcsapr2cmacS3.c1.20250305.030006.nc']Load Data into Py-ART and Plot
radar = pyart.io.read(cmac_files[0])display = pyart.graph.RadarDisplay(radar)
fig = plt.figure(figsize=[7, 5])
ax = fig.add_subplot(111)
display.plot('rain_rate_A',
0,
vmin=0,
vmax=300,
cmap='HomeyerRainbow')
plt.xlim(-100, 100)
plt.ylim(-100, 100)(-100.0, 100.0)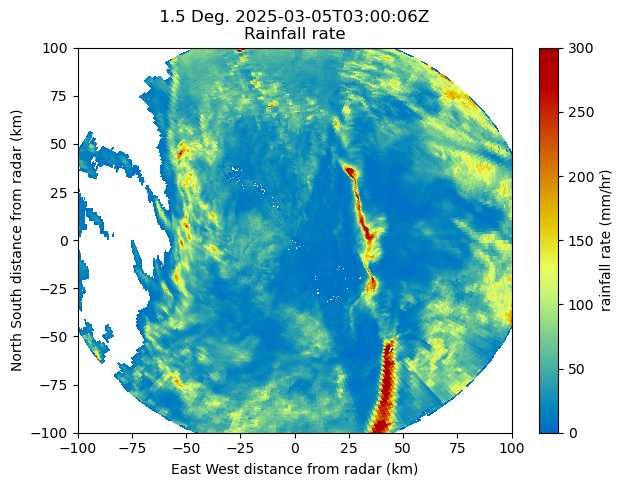
Calculate the Rain Rate Using Z(R)
We have a rain rate using attenuation, but we also need to calculate the rain rate using an established Z(R) relationship. We will only apply this when Z < 35 dBZ.
def reflectivity_rain(radar, refl="reflectivity", alpha=0.0376, beta=0.6112):
    """
    Function to calculate rainfall rates from radar reflectivity factor

    Inputs
    ------
    radar : Py-ART Radar Object
        Py-ART radar object to extract reflectivity field from
    refl : str
        Specific name of reflectivity field within radar object
    alpha : float
        fit parameter
    beta : float
        fit parameter

    Outputs
    -------
    radar : Py-ART Radar Object
        Py-ART radar object with rainfall estimate from reflectivity included
    """
    # define a gatefilter to apply the relationship to
    gatefilter_z = pyart.correct.GateFilter(radar)
    gatefilter_z.exclude_above(refl, 35)
    # Apply the gatefilter to the rain rate
    masked_z = np.ma.masked_array(radar.fields[refl]['data'], mask=gatefilter_z.gate_excluded)
    # Apply the R(Z) relationship
    rr_data = alpha * np.ma.power(np.ma.power(10.0, 0.1 * masked_z), beta)
    # define the dictionary structure for the rain rate data
    rain = pyart.config.get_metadata("radar_estimated_rain_rate")
    rain["long_name"] = "R(Z) Radar Estimated Rain Rate"
    rain["standard_name"] = "R(Z) Radar Estimated Rain Rate"
    rain["data"] = rr_data
    # add the field back into the radar object
    radar.add_field("rain_rate_Z", rain, replace_existing=True)

    return radar
def mask_kdp_rain(radar, phase="specific_differential_phase"):
"""
Function to mask R(A) fields using 35 dBZ threshold
Inputs
------
radar : Py-ART Radar Object
Py-ART radar object to extract reflectivity field from
refl : str
Specific name of reflectivity field within radar object
alpha : float
fit parameter
beta : float
fit parameter
Outputs
-------
radar : Py-ART Radar Object
Py-ART radar object with rainfall estimate from reflectivity included
"""
# define a gatefilter to apply the relationship to
gatefilter_kdp = pyart.correct.GateFilter(radar)
gatefilter_kdp.exclude_below('reflectivity', 35)
# Apply the gatefilter to the rain rate
radar.fields[phase]["data"] = np.ma.masked_array(radar.fields[phase]['data'], mask=gatefilter_kdp.gate_excluded)
return radarradar = reflectivity_rain(radar)
radar = mask_kdp_rain(radar)display = pyart.graph.RadarDisplay(radar)
# Generate matplotlib figure and axe array objects
fig, axarr = plt.subplots(1, 2, figsize=[14, 5])
plt.subplots_adjust(wspace=0.2, hspace=0.35)
# reflectivity
display.plot('rain_rate_Z',
sweep=0,
ax=axarr[0],
vmin=0,
vmax=300,
cmap='HomeyerRainbow',
)
# differential reflectivity
display.plot("rain_rate_A",
sweep=0,
ax=axarr[1],
vmin=0,
vmax=300,
cmap='HomeyerRainbow',)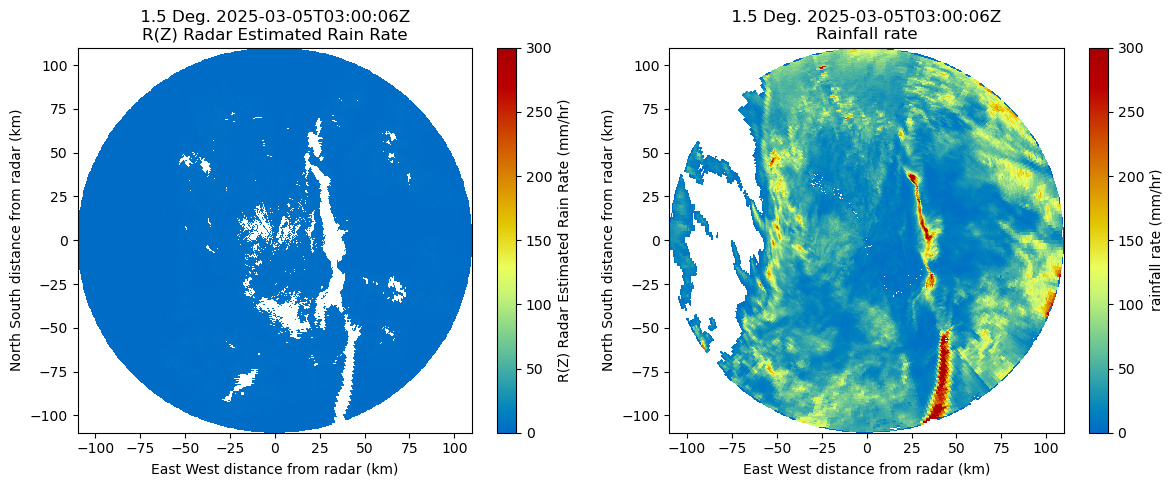
Create Combined Data Product
def add_combined_rain(radar):
radar = reflectivity_rain(radar)
radar = mask_kdp_rain(radar)
combined_data = np.where(~radar.fields["rain_rate_Z"]["data"].mask, radar.fields["rain_rate_Z"]["data"], radar.fields["rain_rate_A"]["data"])
# Combine the masks using logical OR (mask where either is masked)
combined_mask = np.ma.mask_or(radar.fields["rain_rate_Z"]["data"].mask, radar.fields["rain_rate_A"]["data"].mask)
# Merge data and apply the combined mask
merged = np.ma.array(combined_data, mask=combined_mask)
# define the dictionary structure for the rain rate data
rain = pyart.config.get_metadata("radar_estimated_rain_rate")
rain["long_name"] = "R(Z+A) Radar Estimated Rain Rate"
rain["standard_name"] = "R(Z+A) Radar Estimated Rain Rate"
rain["data"] = combined_data
# add the field back into the radar object
radar.add_field("rain_rate_combined", rain, replace_existing=True)
return radardisplay = pyart.graph.RadarDisplay(radar)
# Generate matplotlib figure and axe array objects
fig, axarr = plt.subplots(1, 2, figsize=[14, 5])
plt.subplots_adjust(wspace=0.2, hspace=0.35)
# reflectivity
display.plot('rain_rate_combined', sweep=0, ax=axarr[0], cmap='ChaseSpectral', vmax=300)
# reflectivity
display.plot('reflectivity', sweep=0, ax=axarr[1], cmap='ChaseSpectral')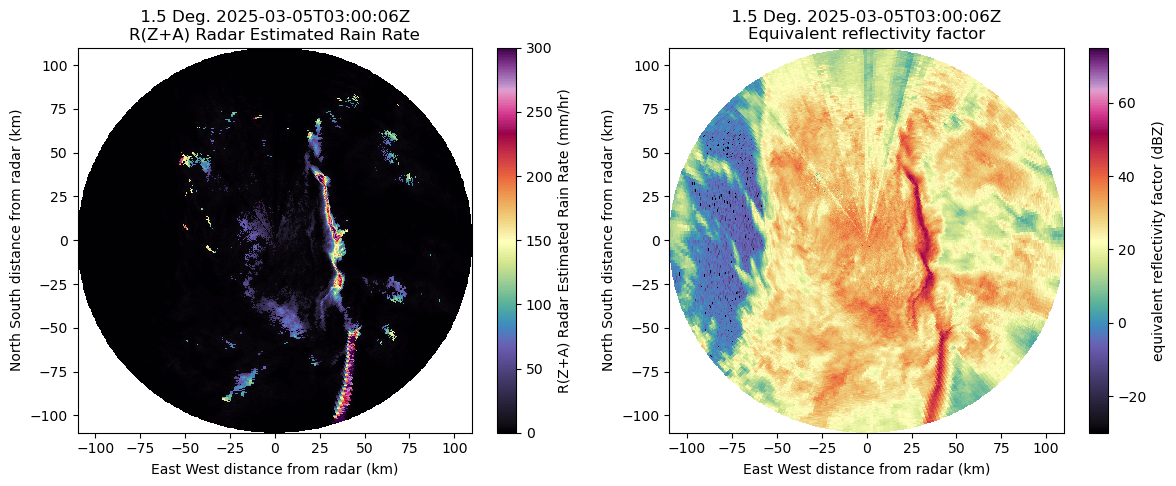
Grid Using Nearest Neighbor Interpolation
Setup a Helper Function and Configure our Grid
def compute_number_of_points(extent, resolution):
    """
    Create a helper function to determine number of points
    """
    return int((extent[1] - extent[0])/resolution) + 1

# Grid extents in meters
z_grid_limits = (250.,10_250.)
y_grid_limits = (-80_000.,80_000.)
x_grid_limits = (-80_000.,80_000.)

# Grid resolution in meters
grid_resolution = 500
Once we setup our interpolation, we can compute the number of points for each extent
x_grid_points = compute_number_of_points(x_grid_limits, grid_resolution)
y_grid_points = compute_number_of_points(y_grid_limits, grid_resolution)
z_grid_points = compute_number_of_points(z_grid_limits, grid_resolution)

print(z_grid_points,
      y_grid_points,
      x_grid_points)
21 321 321
Create our Grid using grid_from_radars
grid = pyart.map.grid_from_radars(radar,
                                  grid_shape=(z_grid_points,
                                              y_grid_points,
                                              x_grid_points),
                                  grid_limits=(z_grid_limits,
                                               y_grid_limits,
                                               x_grid_limits),
                                  method='nearest',
                                  fields=["reflectivity",
                                          "rain_rate_A",
                                          "rain_rate_Z",
                                          "rain_rate_combined"],
                                  constant_radius=500
                                 )
Visualize our Grid
We start by converting our grid to xarray
ds = grid.to_xarray()
dsprint(f"min lat: {ds.lat.min().values} max lat: {ds.lat.max().values}")
print(f"min lon: {ds.lon.min().values} max lon: {ds.lon.max().values}")min lat: 33.90827445523845 max lat: 35.35026397833209
min lon: -88.01516112168518 max lon: -86.25107766396387
ds.rain_rate_A.isel(z=2).plot(x='lon',
                              y='lat',
                              cmap='HomeyerRainbow')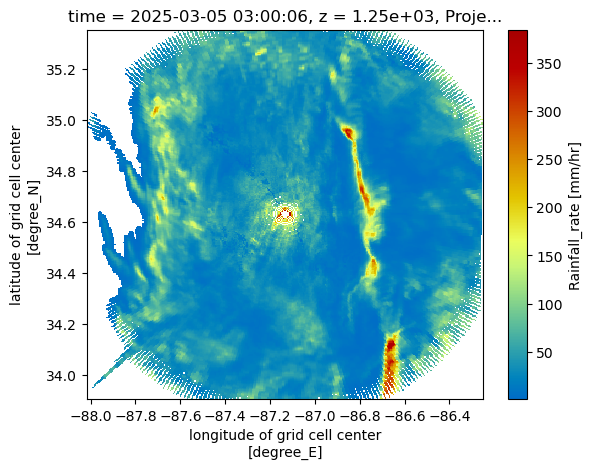
Determine the Lowest Height in Each Column
We plotted the lowest level (500 m) in the plot above. It would be more helpful to have data from the lowest data point (lowest z) in each column (across time, latitude, and longitude)
We start first by creating a new field in our dataset, height_expanded, which is a four-dimensional (time, z, x, y) vertical coordinate, with nan values where we have missing snow rate values.
ds["height_expanded"] = (ds.z * (ds.rain_rate_combined/ds.rain_rate_combined)).fillna(10_000)Next, we find the index of the lowest value in this column, using the .argmin method, looking over the column (z)
min_index = ds.height_expanded.argmin(dim='z',
                                      skipna=True)
Here is a plot of the lowest value height in the column for our domain:
**Notice how some values are the top of the column - 5000 m, whereas some of the values are close lowest vertical level, 500 m
ds.height_expanded.isel(z=min_index).plot(vmin=500,
                                          vmax=5_000)
plt.title("Lowest Gate Used for QPE [m]")
plt.xlabel("Distance from Origin [meters]")

plt.tight_layout();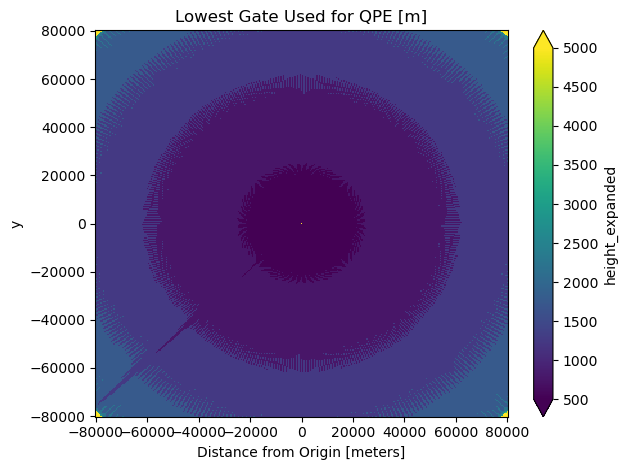
Apply this to our snow fields
We first check for snow fields in our dataset, by using the following list comprehension line:
snow_fields = [var for var in list(ds.variables) if "rain" in var]
snow_fields
['rain_rate_A', 'rain_rate_Z', 'rain_rate_combined']Next, we subset our dataset for only these fields and select our lowest z value (using the index we built before)
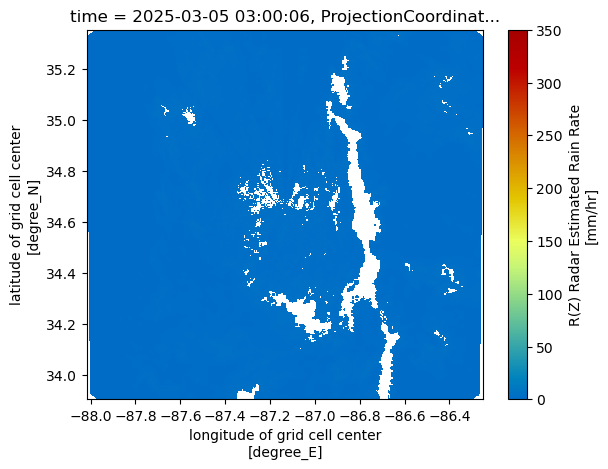
subset_ds = ds[snow_fields].isel(z=min_index)Visualize our closest-to-ground snow value
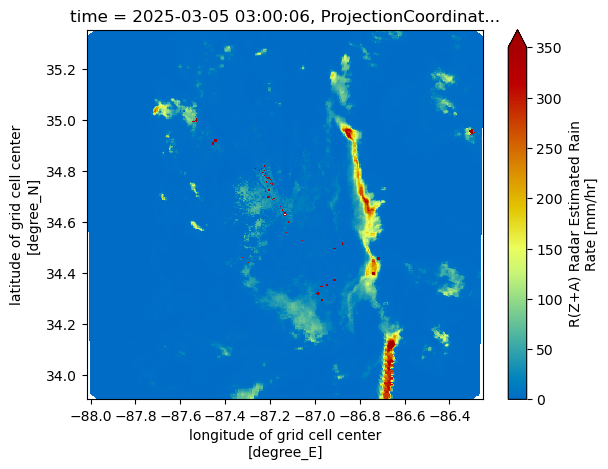
Now that we have the lowest vertical level in each column, let’s plot our revised maps, which only have dimensions:
time
latitude
longitude
subset_ds["rain_rate_combined"].where(subset_ds["rain_rate_combined"] < 1000, np.nan).plot()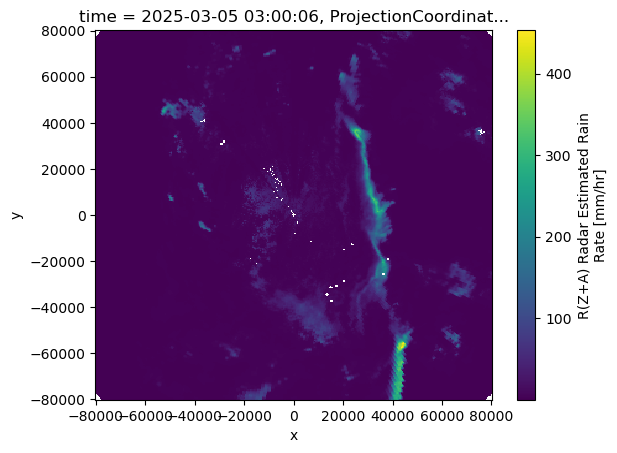
for snow_field in snow_fields:
    subset_ds[snow_field].plot(x='lon',
                               y='lat',
                               cmap='HomeyerRainbow',
                               vmin=0,
                               vmax=350)
    plt.show()
    plt.close()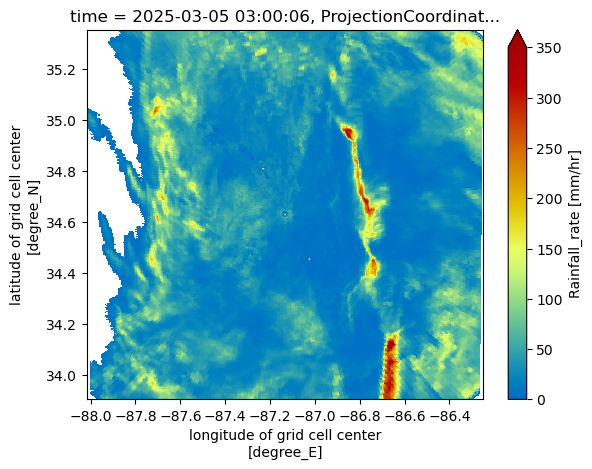
Wrap this Up into a Function
Now that we have the full pipeline, let’s wrap this into a function!
def grid_radar(file,
               # Grid extents in meters
               z_grid_limits = (250.,10_250.),
               y_grid_limits = (-80_000.,80_000.),
               x_grid_limits = (-80_000.,80_000.),
               # Grid resolution in meters
               grid_resolution = 500
               ):
    """
    Grid the radar using some provided parameters
    """

    radar = pyart.io.read(file)

    # Add R(Z) field, mask R(A), add combined rain field
    radar = add_combined_rain(radar)

    x_grid_points = compute_number_of_points(x_grid_limits, grid_resolution)
    y_grid_points = compute_number_of_points(y_grid_limits, grid_resolution)
    z_grid_points = compute_number_of_points(z_grid_limits, grid_resolution)

    grid = pyart.map.grid_from_radars(radar,
                                      grid_shape=(z_grid_points,
                                                  y_grid_points,
                                                  x_grid_points),
                                      grid_limits=(z_grid_limits,
                                                   y_grid_limits,
                                                   x_grid_limits),
                                      fields=["reflectivity",
                                              "rain_rate_A",
                                              "rain_rate_Z",
                                              "rain_rate_combined"],
                                      constant_radius=500,
                                      method='nearest'
                                     )
    return grid.to_xarray()

def subset_lowest_vertical_level(ds, additional_fields=["reflectivity"]):
    """
    Filter the dataset based on the lowest vertical level
    """
    rain_fields = [var for var in list(ds.variables) if "rain" in var] + additional_fields

    # Create a new 4-d height field
    ds["height_expanded"] = (ds.z * (ds[rain_fields[0]]/ds[rain_fields[0]])).fillna(5_000)

    # Find the minimum height index
    min_index = ds.height_expanded.argmin(dim='z',
                                          skipna=True)

    # Subset our snow fields based on this new index
    subset_ds = ds[rain_fields].isel(z=min_index)

    for field in rain_fields:
        subset_ds[field].where(subset_ds[field] < 1000, np.nan)

    return subset_ds
Loop Through and Apply this Workflow
Now that we have our helper functions, we can apply our workflow to each file.
for file in cmac_files:
    ds = grid_radar(file)
    out_ds = subset_lowest_vertical_level(ds)

    # Create an output path
    out_path = f"{Path(file).stem.replace('cmac', 'squire')}.nc"
    out_ds.to_netcdf(f"data/squire/{out_path}")
    print("Finished writing:", out_path)
Finished writing: bnfcsapr2squireS3.c1.20250305.030006.nc