Fun With Gatefilters
Overview
Within this notebook, we will cover:
Introduce gatefilters
Show an example filtering on angle
Use this in a QVP
Prerequisites
| Concepts | Importance | Notes |
|---|---|---|
| Intro to Cartopy | Helpful | Basic features |
| Matplotlib Basics | Helpful | Basic plotting |
| NumPy Basics | Helpful | Basic arrays |
Time to learn: 45 minutes
import os
import warnings

import cartopy.crs as ccrs
import matplotlib.pyplot as plt

import matplotlib.pyplot as plt

import pyart
from pyart.testing import get_test_data
import xradar as xd
import numpy as np

warnings.filterwarnings("ignore")
## You are using the Python ARM Radar Toolkit (Py-ART), an open source
## library for working with weather radar data. Py-ART is partly
## supported by the U.S. Department of Energy as part of the Atmospheric
## Radiation Measurement (ARM) Climate Research Facility, an Office of
## Science user facility.
##
## If you use this software to prepare a publication, please cite:
##
##     JJ Helmus and SM Collis, JORS 2016, doi: 10.5334/jors.119
# Read in a C-SAPR file from the Bankhead National Forest.
csapr = pyart.io.read('bnfcsapr2cfrS3.a1.20250422.040012.nc')csapr.metadata['doi']'10.5439/1467901'Bharadwaj, Nitin, Collis, Scott, Hardin, Joseph, Isom, Bradley, Lindenmaier, Iosif, Matthews, Alyssa, Nelson, Danny, Feng, Ya-Chien, Rocque, Marquette, Wendler, Tim, and Castro, Vagner. C-Band Scanning ARM Precipitation Radar, 2nd Generation. United States: N. p., 2021. Web. doi:10.5439/1467901.
# Simply my favourite colormap
my_favorite_colormap = pyart.graph.cmweather.cm_colorblind.ChaseSpectral
mydc = pyart.graph.RadarDisplay(csapr)
mydc.plot_ppi('reflectivity', cmap=my_favorite_colormap)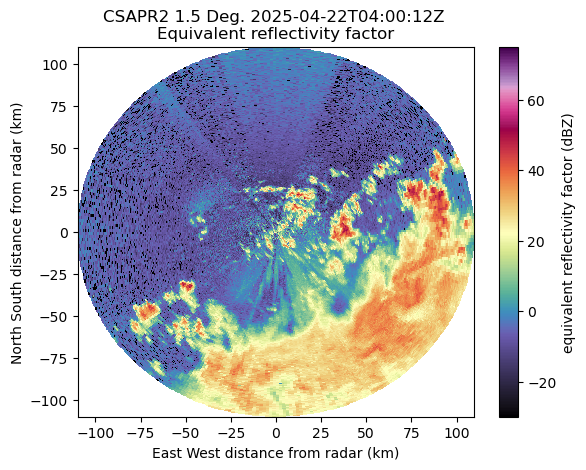
mygf = gatefilter = pyart.correct.GateFilter(csapr)
mygf.exclude_below('reflectivity', 0)
mydc = pyart.graph.RadarDisplay(csapr)
mydc.plot_ppi('reflectivity', cmap=my_favorite_colormap, gatefilter=mygf)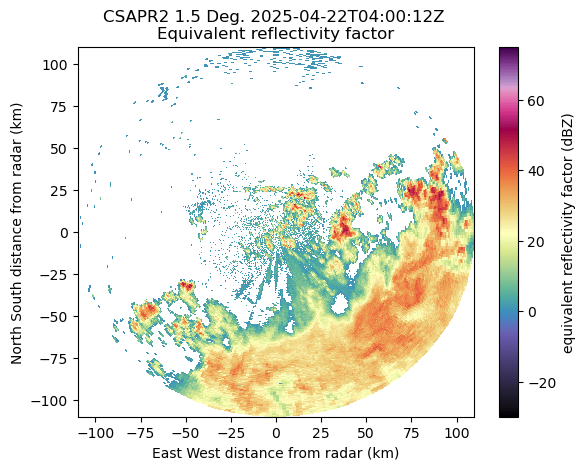
#Get Azimuths
azmth = csapr.azimuth['data']
#Make this into the same shape as our radar field data
azmth_square = np.repeat(np.expand_dims(azmth, 1), len(csapr.range['data']), axis=1)
#add the field
csapr.add_field_like('reflectivity', 'azsq', azmth_square, replace_existing=True)
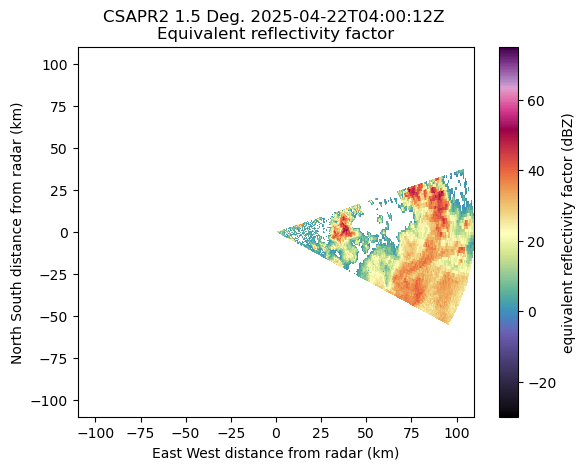
#Make a gate filter
mygf_angles = pyart.correct.GateFilter(csapr)
#filter on aziumth, 10 to 20 degrees
mygf_angles.exclude_outside('azsq', 70,120)
mygf_angles.exclude_invalid('reflectivity')
mygf_angles.exclude_below('reflectivity', 0)
#See what we got
myd = pyart.graph.RadarDisplay(csapr)
myd.plot_ppi('reflectivity', gatefilter = mygf_angles, cmap=my_favorite_colormap)
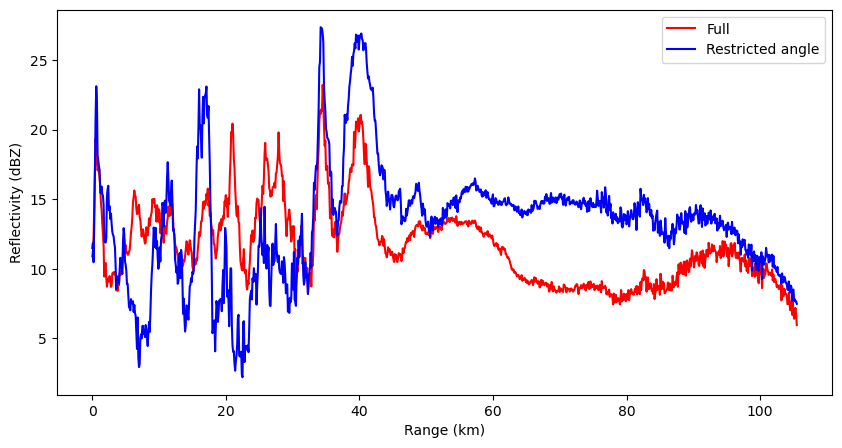
myvp_ang = pyart.retrieve.quasi_vertical_profile(csapr, fields='reflectivity', desired_angle =5, gatefilter=mygf_angles)
myvp_full = pyart.retrieve.quasi_vertical_profile(csapr, fields='reflectivity', desired_angle =5, gatefilter=mygf)
[ 1.4996338  2.4993896  3.4991455  4.4989014  5.498657   6.498413
  7.998047   9.997559  12.002563  14.002075  17.50122   21.500244
 25.999146  32.997437  42.000732 ]
41.97876
[ 1.4996338  2.4993896  3.4991455  4.4989014  5.498657   6.498413
  7.998047   9.997559  12.002563  14.002075  17.50122   21.500244
 25.999146  32.997437  42.000732 ]
41.97876
myf = plt.figure(figsize=[10,5])
plt.plot(csapr.range['data']/1000.0, myvp_full['reflectivity'], color='r', label='Full')
plt.plot(csapr.range['data']/1000.0, myvp_ang['reflectivity'], color='b', label='Restricted angle')
plt.xlabel('Range (km)')
plt.ylabel('Reflectivity (dBZ)')
plt.legend()